The 5ms Lie: Why Your “Green” Dashboard is Killing Nutanix Metro Availability (And How to Fix It)
I have been in the War Room. You know the one. The application team is screaming that the database is freezing every few minutes. The storage team checks Prism—everything looks fine. The network team checks SolarWinds—links are green.
Yet, the application is timing out.
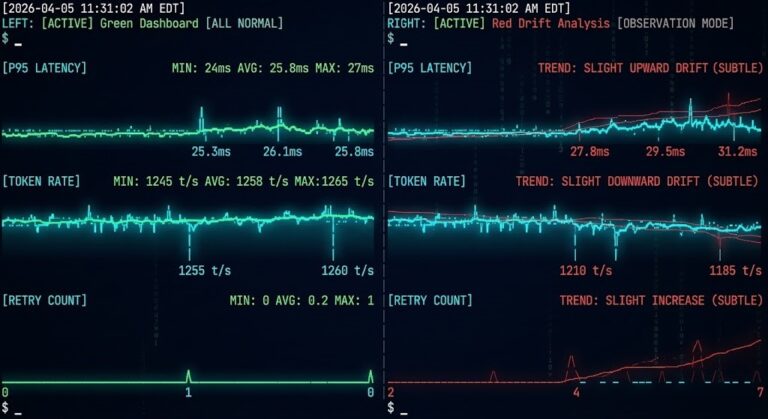
The culprit isn’t a hard down. It’s a micro-burst. A momentary spike in latency (say, 200ms for 2 seconds) that vanishes before your monitoring tool polls again 58 seconds later. For standard apps, this is a blip. For Nutanix Metro Availability, which demands rigid sub-5ms Round-Trip Time (RTT) for synchronous writes, this is a “stop the world” event.
We built the Nutanix Metro Latency Monitor to solve this exact blind spot.
The Engineering Gap: Polling Frequency vs. Physics
When designing Metro clusters, we obsess over the 5ms RTT rule. If site-to-site latency exceeds this, write I/O pauses to protect data consistency. If the pause lasts too long (often 10–30 seconds), the Metro relationship fractures, or the VM hangs.
Here is the problem with your enterprise monitoring stack:
| Feature | Enterprise Monitor (Datadog/SolarWinds) | Rack2Cloud Metro Monitor |
| Polling Interval | 60 seconds (Standard) | 250ms (4x per second) |
| Metric Focus | Average Latency (Smoothed) | Real-Time Jitter (Standard Deviation) |
| Protocol | ICMP (Ping) often deprioritized | HTTPS/TCP Handshake (Application Layer) |
| Sensitivity | Misses bursts < 30 seconds | Catches bursts > 250ms |
| Deployment | Agents, SNMP, Firewalls | Zero-Install (Browser-based) |
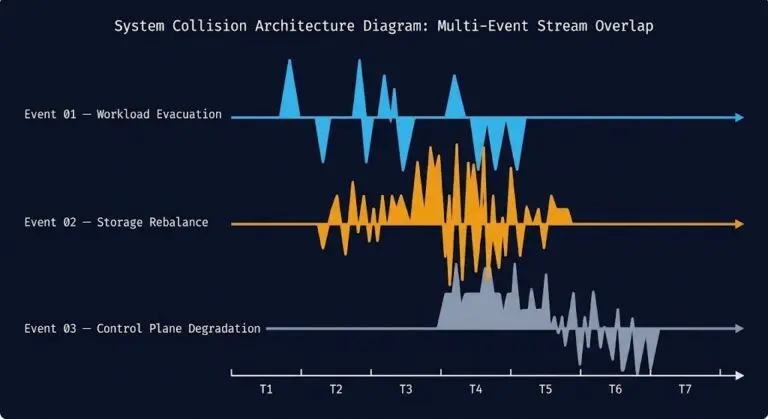
The underlying physics behind why 60-second polling fails — microburst behavior, TCP retransmit amplification, and jitter variance under concurrent I/O load — are covered in depth in Physics of Disconnected Cloud.
The Decision Framework
- Use Datadog/SolarWinds for historical trending, capacity planning, and long-term SLAs.
- Use the Rack2Cloud Metro Monitor for real-time troubleshooting during a “Yellow” event, pre-flight checks before enabling Metro, or validating network path stability during a change window.
The full tool documentation — including the favicon HEAD request method, sovereign probing architecture, and jitter threshold reference — is on the Metro Latency Scout page.
Inside the Tool: Architecture & “Security by Topology”
We designed this tool with a specific philosophy: “Think Like an Architect, Build Like an Engineer.” We didn’t want another heavy VM to manage. We wanted a lightweight, ephemeral probe.
The “Browser-as-Probe” Design
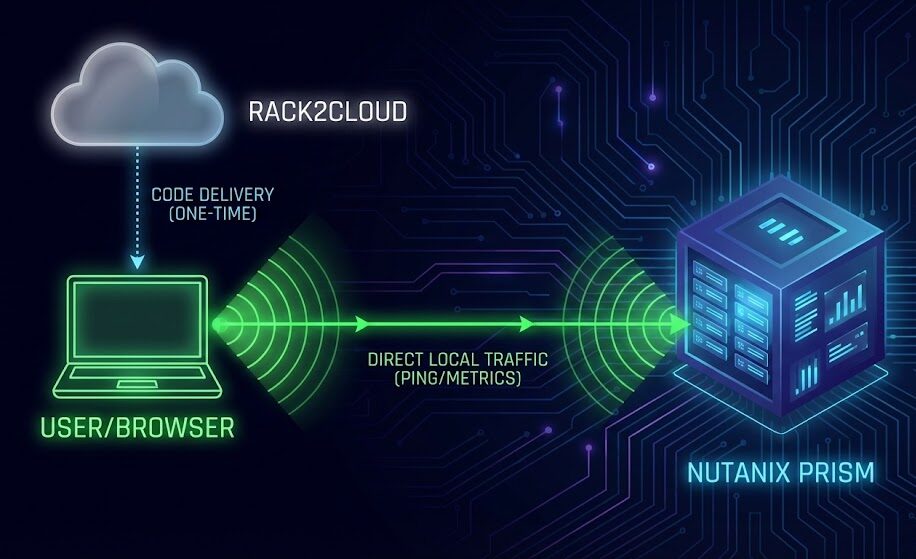
Even though this tool is hosted on the public web, it communicates directly with your private infrastructure.
- The Code is Static: The tool is loaded into your browser from our servers.
- The Execution is Local: When you click “Start,” your browser becomes the probe.
- The Traffic is Private: The pings go directly from your laptop (on the VPN) to your internal Nutanix VIP. Zero data is sent to the cloud. Rack2Cloud never sees your IPs or your latency stats.
The Math: Why We Track Jitter
The tool doesn’t just show you “3ms.” It calculates Jitter ($\sigma$) over a rolling 60-second window.
If your average latency is 2ms, but your jitter is 10ms, your link is unstable. Metro Availability hates instability more than it hates high latency. The tool’s “Risk Score” algorithm triggers a “DEGRADED” alert if:
- Average Latency > 5ms OR
- Standard Deviation (Jitter) > 2.0
Cost Analysis: The Price of “Free” vs. Downtime
Let’s look at the financial architecture of this solution.
Option A: The Commercial Approach
To get sub-second granularity from a commercial tool like Datadog, you often have to enable “High Resolution Metrics.”
- Cost: Significantly higher ingestion costs (often 10x per metric).
- Complexity: Requires custom agent configuration on both sides of the link.
Option B: The Rack2Cloud Tool
- CapEx: $0.
- OpEx: $0.
- Value: Prevents a Metro “Split-Brain” scenario or an unnecessary failover event, which can cost thousands in engineering hours to remediate and verify.
Verdict: For the specific use case of troubleshooting active latency issues, the Rack2Cloud tool offers an infinite ROI compared to upgrading your commercial monitoring tier.
Try the Tool Now
We host the latest stable build of the Metro Monitor directly on Rack2Cloud. You don’t need to deploy servers or install agents.
Browser-based RTT and jitter detection at 250ms resolution. No agents, no installs, no data leaving your network. The Scout runs directly in your browser and maps the micro-bursts that trigger synchronous replication degradation before they appear in Prism — the exact blind spot this post covers.
→ Launch Metro Latency Scout⚠️ Critical Step: The “SSL Handshake”
Because this tool is hosted on the secure public web (HTTPS) but connects to your Private Nutanix IP (which uses a self-signed certificate), modern browsers will initially block the connection.
To make it work:
- Launch the tool.
- Enter your Prism VIP.
- If you see a yellow warning box, click the link provided to open your Prism page in a new tab.
- Accept the “Unsafe” certificate warning in that tab.
- Close the tab and click “Start Monitor” again.
🔑 Key Takeaways
- The Polling Gap: Standard monitoring tools (Datadog, SolarWinds) poll every 60 seconds, completely missing the sub-second micro-bursts that kill synchronous replication.
- Jitter > Latency: In Metro Availability, average latency matters less than standard deviation (jitter). Stability is the metric that actually predicts failures.
- Client-Side Probing: We built a free, serverless tool that uses your browser as a high-frequency probe (4Hz) to detect what your expensive tools miss.
- Zero Infrastructure: No agents to install. No VMs to deploy. Just open the link and start monitoring.
For the full Metro cluster deployment sequence — from hardware requirements through AOS configuration and Go/No-Go pre-flight validation — the HCI Architecture Learning Path covers Metro Availability as a structured progression from single-site HCI
This technical deep-dive has passed the Rack2Cloud 3-Stage Vetting Process: Lab-Validated, Peer-Challenged, and Document-Anchored. No vendor marketing influence. Just field-tested engineering.
Additional Resources
Editorial Integrity & Security Protocol
This technical deep-dive adheres to the Rack2Cloud Deterministic Integrity Standard. All benchmarks and security audits are derived from zero-trust validation protocols within our isolated lab environments. No vendor influence.
R.M.
Senior Solutions Architect with 25+ years of experience in HCI, cloud strategy, and data resilience. As the lead behind Rack2Cloud, I focus on lab-verified guidance for complex enterprise transitions. View Credentials →
Get the Playbooks Vendors Won’t Publish
Field-tested blueprints for migration, HCI, sovereign infrastructure, and AI architecture. Real failure-mode analysis. No marketing filler. Delivered weekly.
Select your infrastructure paths. Receive field-tested blueprints direct to your inbox.
- > Virtualization & Migration Physics
- > Cloud Strategy & Egress Math
- > Data Protection & RTO Reality
- > AI Infrastructure & GPU Fabric
Zero spam. Includes The Dispatch weekly drop.
Need Architectural Guidance?
Unbiased infrastructure audit for your migration, cloud strategy, or HCI transition.
>_ Request Triage Session