

GPU ORCHESTRATION & CUDA
Silicon Is Not the Constraint. Scheduling Is.
GPU orchestration is not a hardware problem. Most teams discover this after the cluster is already provisioned — when expensive silicon sits at 40% effective utilization, when distributed training jobs stall for reasons the GPU vendor’s dashboard cannot explain, when inference latency spikes on a cluster that looks healthy by every standard metric. The GPUs are fine. The orchestration is wrong.
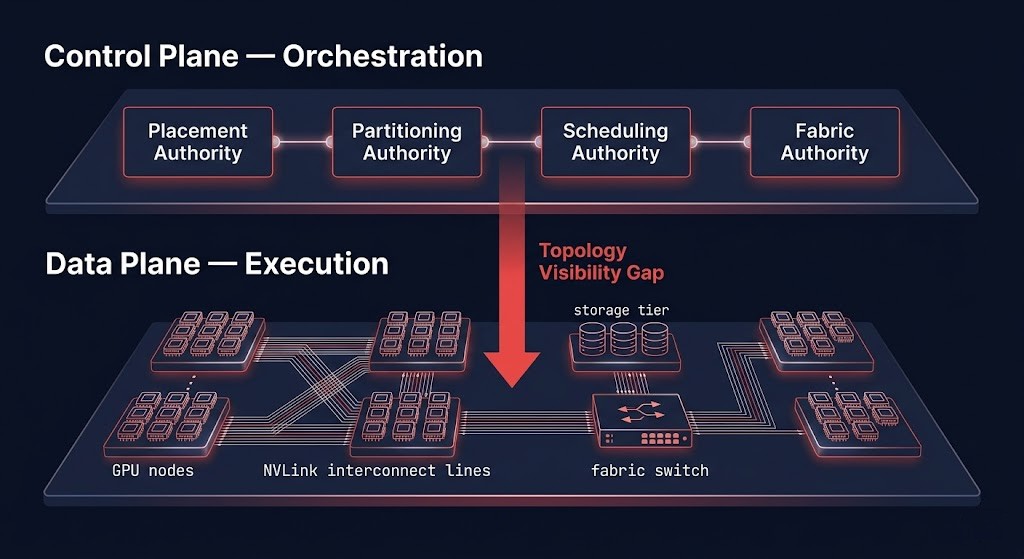
The architectural gap is consistent across organizations that provision GPU infrastructure for the first time: they apply the mental model from virtualization or containerized compute, where the unit of scheduling is the CPU core or the container. In GPU infrastructure, that model fails immediately. The unit of meaningful scheduling is not the GPU — it is the topology. NVLink domain membership, NUMA zone, PCIe lane placement, RDMA path, and memory bandwidth ceiling all determine whether a GPU workload runs efficiently or expensively. A scheduler that sees GPU count but cannot see topology is not orchestrating a cluster. It is assigning jobs to hardware and hoping.
This sub-page covers the silicon and scheduling layer of the AI infrastructure stack: how GPUs are partitioned through MIG, how topology-aware scheduling differs from naive GPU assignment, why GPU utilization metrics reliably mislead, and how training and inference require architecturally opposite orchestration models. The GPU Orchestration Authority Model maps the four governance layers — placement, partitioning, scheduling, and fabric — where decisions must be explicit before workloads arrive.
The practical consequence of getting this layer wrong is not a single incident. It is persistent, silent underperformance. Clusters that cost $40/hour per 16x H100 node while delivering the effective throughput of half that. Training jobs that run 15% slower than the hardware should allow because the fabric path crosses a PCIe boundary the scheduler didn’t know existed. Inference bills that compound past forecast because GPU utilization looks healthy while actual compute occupancy does not. These are not hardware failures. They are orchestration failures. And they are entirely preventable.
The GPU Is No Longer the Unit of Scheduling
This is the architectural shift that separates GPU operations from AI systems architecture. When GPUs were independent accelerators — one job, one GPU, no coordination required — scheduling by GPU count was sufficient. nvidia.com/gpu: 1 in a Kubernetes resource request meant something actionable. A pod needed a GPU. The scheduler found one. Done.
That model broke when AI workloads began requiring coordinated execution across multiple GPUs. At that point, GPU count stopped being the scheduling primitive and topology became the real constraint. A distributed training job that spans two GPUs connected by NVLink completes all-reduce in microseconds. The same job spanning two GPUs connected only by PCIe — on separate NUMA nodes, sharing a host bus — pays a 7x bandwidth penalty on every gradient synchronization cycle. The scheduler assigned two GPUs. But it assigned the wrong two GPUs, and the hardware paid for it in every training step.
The GPU Abstraction Collapse is the name for this architectural shift — the point at which GPU-count scheduling stops being adequate and topology-aware scheduling becomes mandatory. It happens at different scales for different workloads, but the trigger is always the same: when workload performance depends on the physical relationship between GPUs, not just their availability.
What the scheduler must now see — and what nvidia.com/gpu: 1 cannot express:
THE GPU ABSTRACTION COLLAPSE — WHAT THE SCHEDULER MUST NOW SEE
- NVLink domain membership — which GPUs share high-bandwidth interconnect and can participate in efficient all-reduce
- NUMA zone — whether GPU memory access crosses a NUMA boundary, adding latency to every host-to-device transfer
- PCIe lane placement — which GPUs share a PCIe switch and what the bandwidth ceiling is between them
- RDMA path — which network interfaces provide direct memory access for inter-node gradient exchange
- HBM bandwidth ceiling — available memory bandwidth per GPU and whether the workload’s memory access pattern saturates it
- Checkpoint storage locality — whether the storage layer for optimizer state is topologically close or requires cross-zone I/O
The consequence is direct: organizations that provision GPU clusters without modeling topology — without enforcing NVLink domain awareness in scheduling, without NUMA-aligned pod placement, without RDMA path validation — are paying for hardware capability they cannot access. The silicon is capable. The orchestration layer cannot see it.
GPU Architecture for Architects
Understanding what the orchestration layer must govern requires understanding the hardware primitives it governs. This is not a CUDA programming tutorial — it is the minimum hardware model an infrastructure architect needs to make correct scheduling, partitioning, and fabric decisions.
Streaming Multiprocessors and the SM model. A GPU is organized into Streaming Multiprocessors — independent compute units, each containing CUDA cores, Tensor Cores, and local shared memory. Scheduler decisions affect SM utilization directly: a workload that cannot fill SMs with active warps leaves compute capacity idle while reporting GPU activity. The gap between GPU utilization (any kernel running) and SM utilization (SMs actively executing warps) is where most orchestration waste hides.
HBM vs GDDR — memory bandwidth as the inference bottleneck. High Bandwidth Memory (HBM) is the memory architecture used on data center GPUs: H100, A100, the full NVIDIA data center line. HBM stacks memory dies directly on the GPU package, delivering bandwidth in the range of 2–3 TB/s — compared to GDDR6X at roughly 1 TB/s on consumer-class hardware. For inference workloads, where the GPU spends significant time loading model weights from memory rather than computing, memory bandwidth is the actual throughput constraint. Schedulers that treat all GPU memory as equivalent miss the implication: HBM-equipped GPUs are inference-capable in ways GDDR-equipped hardware is not, regardless of CUDA core count.
NVLink vs PCIe — which workload class each interconnect serves. NVLink is NVIDIA’s high-bandwidth, low-latency GPU interconnect. On H100 NVL configurations, NVLink delivers 900 GB/s of bidirectional bandwidth between GPUs in the same NVLink domain. PCIe — the fallback interconnect when NVLink is unavailable or when GPUs span separate nodes — delivers 128 GB/s in current PCIe 5.0 configurations. For distributed training workloads where all-reduce operations exchange gradients across every GPU in a job, that 7x bandwidth difference compounds across every training step. Topology-unaware placement that splits a training job across NVLink domains is not a configuration suboptimality — it is a structural performance penalty that cannot be recovered at runtime.
Why GPU Utilization Metrics Lie
95% GPU utilization is the most misleading number in AI infrastructure. It measures whether a kernel is scheduled and running on the GPU — not whether that kernel is doing useful compute work. A GPU can be 95% utilized while a poorly designed workload stalls its memory pipelines, underuses Tensor Cores, and delivers a fraction of its theoretical throughput. The dashboard looks healthy. The hardware is not working.
Understanding what each metric actually measures is prerequisite to diagnosing orchestration problems:
| Metric | What It Actually Measures | What It Misses |
|---|---|---|
| GPU Utilization | Kernel scheduling activity — whether any kernel is running on the GPU at a given time | Whether that kernel is doing useful compute or stalling on memory access |
| SM Utilization | Compute occupancy across streaming multiprocessors — active warp execution rate | Memory-bound stalls masking as SM activity; warps waiting for data are counted as active |
| Memory Controller Utilization | Memory access pressure — how busy the memory subsystem is serving requests | Whether the bandwidth ceiling is being reached or whether access patterns are inefficient |
| Tensor Core Utilization | Actual AI acceleration efficiency — whether workloads route to Tensor Cores vs CUDA cores | Bottlenecks that cause work to route to CUDA cores instead of the dedicated AI accelerators |
| NVLink Throughput | Inter-GPU communication efficiency — bandwidth consumed on the NVLink fabric | Congestion at the fabric layer above NVLink; queuing delays that don’t appear as NVLink saturation |
A cluster where GPUs report 95% utilization while SM utilization sits at 20% is memory-bound — the GPUs are waiting for data, not computing. The correct diagnostic is not to reduce GPU count or increase memory allocation. It is to identify whether the bottleneck is HBM bandwidth saturation, inefficient access patterns, or fabric congestion on inter-GPU data exchange. Each has a different remediation path. Treating them as the same problem because the top-level metric looks the same is how orchestration failures compound over months without resolution.
Every orchestration decision — MIG profile selection, topology-aware placement, scheduler configuration, batching strategy — flows from knowing which metric is the real constraint for a given workload class. Organizations optimizing GPU spend by watching a single utilization figure are optimizing against a number that doesn’t represent what they think it does.
MIG — Multi-Instance GPU Partitioning
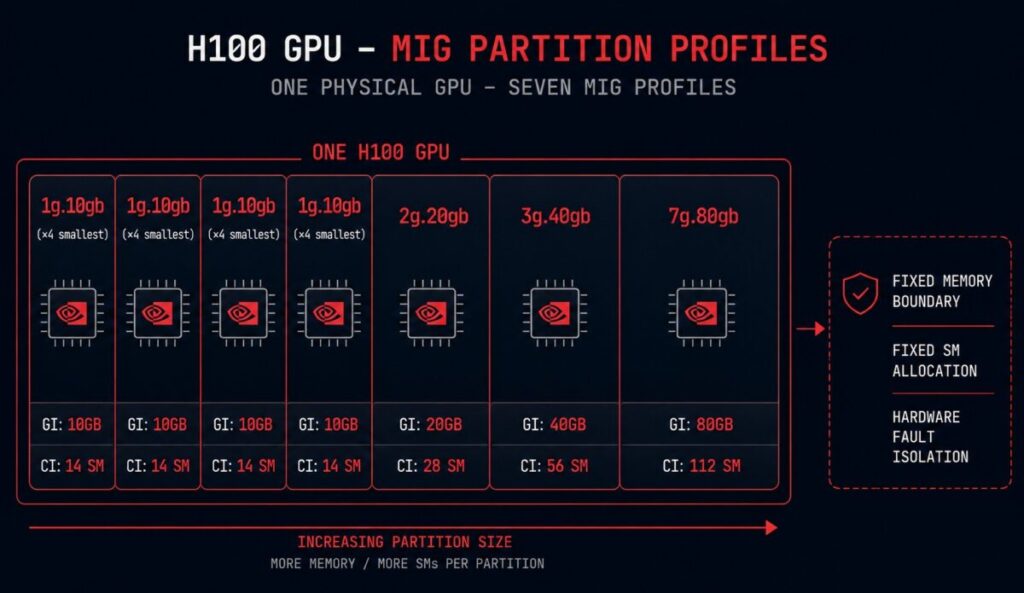
Multi-Instance GPU is NVIDIA’s hardware partitioning technology, available on A100 and H100 GPUs, that divides a single physical GPU into independent, isolated instances — each with its own compute resources, memory, and bandwidth allocation. Each instance behaves as a discrete GPU to the workloads running on it, with full fault isolation: a kernel error in one instance cannot affect another.
The architectural case for MIG is straightforward. Large data center GPUs — an H100 at 80GB HBM3 — are sized for training workloads. Most inference workloads don’t need 80GB. A language model serving endpoint might require 10–20GB. Without partitioning, the remaining 60GB sits allocated but idle, the inference job monopolizes a GPU that should serve four concurrent workloads, and the cost per inference request is 4–5x what it should be. MIG recovers that cost by converting one GPU into up to seven independent inference endpoints.
The framing that matters architecturally: MIG converts GPUs from elastic accelerators into partitioned infrastructure with fixed operational boundaries. That single statement explains why MIG improves inference economics while simultaneously creating new operational complexity. A GPU without MIG can be dynamically allocated to any workload of any size — it is elastic. A GPU with MIG enabled has a fixed partition profile, fixed memory boundaries per instance, and fixed SM allocations per slice. It is now infrastructure. The same properties that make it stable for multi-tenant inference make it rigid for mixed or variable workloads.
The two-level partition model. MIG creates two partition types. A GPU Instance (GI) is the top-level hardware slice — it defines the memory and SM allocation for a partition. A Compute Instance (CI) is a sub-partition within a GI that defines the execution context: how many SM partitions the workload can use. A single GI can contain multiple CIs, allowing further subdivision of compute within a fixed memory allocation. For most inference deployments, a 1:1 GI-to-CI mapping is correct — the complexity of multiple CIs per GI pays off only in specific multi-process serving architectures.
H100 partition profiles. The H100 supports seven standard MIG profiles, ranging from a 1g.10gb slice (one-seventh of compute, 10GB memory) to a 7g.80gb profile (the full GPU, used when MIG is enabled but no partitioning is needed). The 3g.40gb profile — half the GPU — is the most common inference profile for models in the 7B–13B parameter range at FP16 precision. Selecting the wrong profile is a common and silent failure: a model that requires 22GB allocated to a 1g.10gb slice will OOM-kill at load without indicating that the partition size was the cause.
MIG anti-patterns. Partitioning training workloads into MIG slices is the most common misuse. Training jobs require the full memory bandwidth and NVLink connectivity of the physical GPU — MIG instances have reduced bandwidth per slice and cannot participate in NVLink all-reduce across instance boundaries. Running a training job in a MIG instance and wondering why it underperforms relative to specification is a partition architecture error, not a hardware problem. The second anti-pattern is mixing MIG and non-MIG pods in the same node pool. Kubernetes cannot schedule MIG resources and standard GPU resources from the same node simultaneously without explicit device plugin configuration — the result is scheduling failures that are opaque without understanding the underlying partition state.
01 — INFERENCE-ONLY WORKLOADS WITH PREDICTABLE MEMORY FOOTPRINT
Model size is known and stable. Memory allocation per instance can be set at partition time without elasticity requirements. MIG delivers cost efficiency without operational penalty when the workload fits a standard profile.
02 — MULTI-TENANT ISOLATION REQUIRED
Workloads from different teams, services, or tenants must not share GPU memory space. MIG’s hardware isolation boundary is the only enforcement mechanism that prevents memory-level cross-tenant interference — software-level isolation is insufficient for this requirement.
03 — PER-WORKLOAD COST VISIBILITY NEEDED
FinOps or chargeback requirements demand GPU cost attribution at the workload or team level. MIG instances expose discrete resource boundaries that make per-instance billing tractable. Without partitioning, GPU cost attribution is estimation — with MIG, it is measurable.
04 — QOS ENFORCEMENT ON SHARED HARDWARE
Different services running on the same physical GPU must meet different latency SLAs. MIG’s fixed SM and bandwidth allocations enforce performance floors per instance — a noisy inference workload in one partition cannot degrade latency in another. Software-level QoS cannot guarantee this without hardware partition boundaries.
GPU-Aware Scheduling in Kubernetes
Kubernetes exposes GPU resources through the device plugin model. The NVIDIA device plugin registers nvidia.com/gpu as a schedulable resource and advertises available GPUs to the kubelet. A pod that requests nvidia.com/gpu: 1 will be scheduled to a node with at least one available GPU. This works correctly for single-GPU, single-tenant workloads. It fails for everything the AI infrastructure layer actually requires.
The default Kubernetes scheduler is topology-blind. It sees nvidia.com/gpu: 1 as a countable resource, equivalent in structure to CPU millicores or memory bytes. It has no concept of NVLink domain membership, NUMA zone alignment, PCIe lane sharing, or RDMA path availability. A distributed training job that requests four GPUs may receive them from four different NUMA nodes, spanning two PCIe switches, with no NVLink connectivity between any pair — and Kubernetes will report the job as successfully scheduled. The performance consequences are entirely invisible to the scheduler.
Topology-aware GPU scheduling closes this gap through extended resource labeling and scheduling constraints. NUMA-aligned placement ensures GPU and CPU are in the same NUMA zone, eliminating cross-NUMA memory access penalties on host-to-device transfers. NVLink domain awareness groups GPUs by their physical interconnect topology and enforces co-placement for jobs requiring high-bandwidth all-reduce. GPU affinity scheduling extends pod affinity rules to express topology requirements — keeping distributed training pods on nodes that share NVLink connectivity, or keeping inference pods on MIG-partitioned nodes without contaminating training node pools.
The device plugin extension for MIG adds a further scheduling dimension. MIG resources are advertised as distinct resource types — nvidia.com/mig-3g.40gb, nvidia.com/mig-1g.10gb — that pods must request explicitly. The scheduler cannot dynamically select an appropriate MIG profile based on workload requirements. The workload must declare its profile requirement, and nodes must have matching available partitions. This makes MIG scheduling tractable but inflexible: the profile vocabulary is fixed at node provision time, and workloads that don’t match an available profile cannot be scheduled regardless of physical GPU availability. Link sideways to GPU Scheduling in Kubernetes: Start Before the Scheduler.
THE SCHEDULER AUTHORITY COLLAPSE
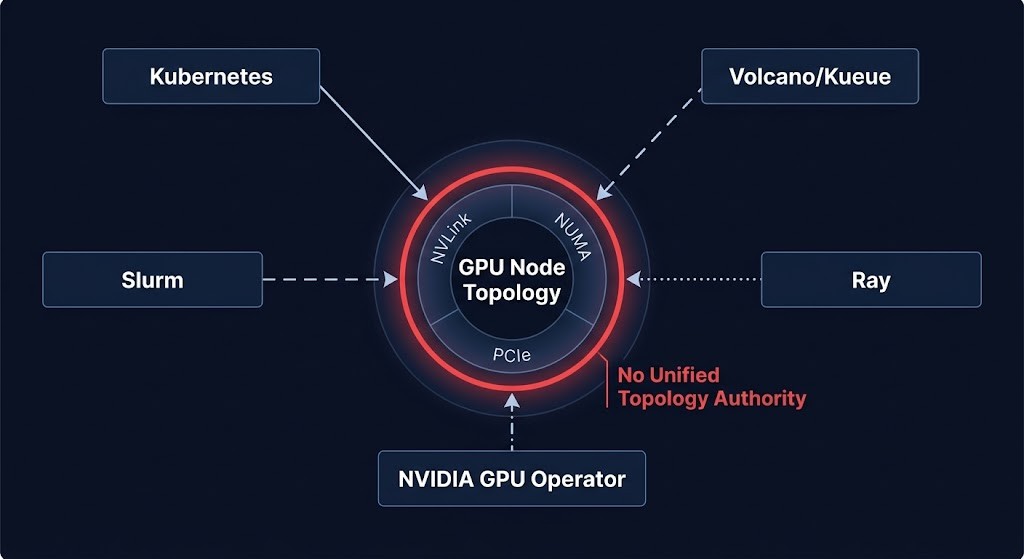
Modern AI clusters increasingly contain multiple orchestration systems operating simultaneously — each with authority over a different slice of the scheduling problem, none with a unified view of GPU topology. The Scheduler Authority Collapse is the point where multiple orchestration systems simultaneously influence GPU placement without a unified topology authority.
Each scheduler sees a different slice of the system:
| Scheduler | What It Sees | What It Misses |
|---|---|---|
| Kubernetes default | Pod resource requests — GPU count, memory, CPU | GPU topology, NVLink domain boundaries, NUMA zones |
| NVIDIA GPU Operator | GPU device state — available instances, MIG profiles, driver health | Job-level gang scheduling requirements, cross-node topology |
| Volcano / Kueue | Gang scheduling coordination — job queues, group placement, priority | Fabric path constraints, RDMA availability, physical interconnect topology |
| Slurm | Node-level resource allocation — CPU, memory, GPU count per node | Kubernetes workload lifecycle, container scheduling semantics |
| Ray | Distributed task graph — actor placement, object store locality | Physical topology below the VM or container layer |
When these schedulers conflict — a common production state in clusters that grew by adding capability rather than by design — jobs land on topologically incompatible nodes, distributed training loses NVLink bandwidth, and the performance gap is attributed to hardware that is working exactly as specified. The unified topology authority is missing. The schedulers filled the vacuum.
The GPU Orchestration Authority Model
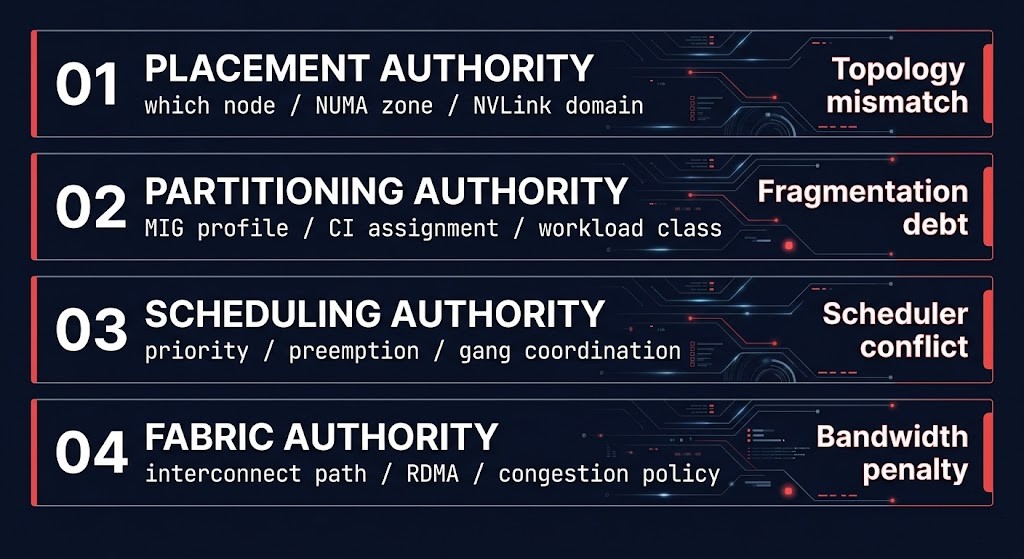
Explicit authority over four layers is what separates GPU clusters that deliver from GPU clusters that idle. Most orchestration failures trace back to the same root cause: one or more of these layers was left implicit — delegated to runtime defaults, scheduler guesses, or configuration that was set once and never revisited. The GPU Orchestration Authority Model defines the four governance layers where decisions must be made before workloads arrive.
01 — PLACEMENT AUTHORITY
Which node, which NUMA zone, which NVLink domain. Placement authority is the first and most consequential governance layer because placement decisions are largely irreversible at runtime — a training job assigned to topologically incompatible nodes cannot be migrated. If placement authority is undefined, the scheduler decides. If the scheduler cannot see topology, it guesses. If it guesses wrong, the hardware pays on every operation.
02 — PARTITIONING AUTHORITY
MIG profile selection, Compute Instance assignment, and workload class mapping. Once MIG partitions are created, they are infrastructure — fixed memory boundaries, fixed SM allocations, fixed bandwidth per slice. Partitioning authority determines which workload classes are served by which partition profiles, and who has the right to change partition state. Without explicit governance, MIG partition profiles drift as teams add workloads ad hoc, fragmentation accumulates, and schedulable topology collapses.
03 — SCHEDULING AUTHORITY
Priority class, preemption policy, and gang scheduling coordination for distributed jobs. In clusters with multiple scheduling systems — Kubernetes, Volcano, Slurm, Ray — scheduling authority defines which system has final placement authority for which workload class, and what happens when they conflict. Without explicit authority boundaries, the Scheduler Authority Collapse produces jobs that cannot run on clusters with available GPUs, distributed training stalls from partial gang placement, and preemption cascades that affect workloads that should have been protected.
04 — FABRIC AUTHORITY
Interconnect path enforcement, congestion policy, RDMA queue depth, and RoCEv2 vs InfiniBand selection. Fabric authority acknowledges the architectural reality that in distributed AI training, the network is not infrastructure supporting the compute — it is part of the compute layer. Gradient synchronization, all-reduce operations, checkpoint I/O, and parameter exchange all execute on the fabric. Fabric behavior is not a network team concern that can be addressed separately. It is a first-class orchestration governance layer. Full fabric architecture is in Distributed AI Fabrics.
These four layers are interdependent. Correct placement authority without partitioning authority produces well-placed jobs on incorrectly partitioned hardware. Correct partitioning without scheduling authority produces the right partition profiles fragmented by uncoordinated allocation. Correct scheduling without fabric authority produces jobs that land on the right nodes but cannot exchange data at the bandwidth the hardware supports. The model is a system, not a checklist — all four layers must be governed explicitly for orchestration to function correctly.
CUDA Execution Model — What Architects Need to Know
CUDA is the programming model and runtime that governs how workloads execute on NVIDIA GPUs. Infrastructure architects do not need to write CUDA code. They need to understand what CUDA exposes about hardware behavior — because CUDA makes hardware topology observable in ways that traditional infrastructure abstracted away.
Virtualization abstracted topology away from applications. CUDA re-exposes topology directly to runtime behavior. A VM running on a hypervisor has no knowledge of the NUMA topology of the physical host, the PCIe lane configuration, or the memory bandwidth ceiling of the underlying hardware — the hypervisor abstracts it. A CUDA workload has direct visibility into memory hierarchy, interconnect latency, NUMA behavior, and bandwidth ceilings. The application runtime is topology-aware whether the infrastructure layer is or not. When the infrastructure layer is not, the CUDA runtime makes placement decisions — and those decisions are not optimized for the cluster’s topology. They are optimized for the local GPU. The mismatch between CUDA’s topology awareness and the infrastructure’s topology blindness is where orchestration failures become permanent performance deficits.
Kernel launch overhead and the batching inflection point. Every CUDA kernel launch carries overhead — context setup, argument transfer, scheduling on the SM. For small batch sizes, kernel launch overhead is significant relative to actual compute time: the GPU spends more cycles preparing to compute than computing. This is the fundamental reason small-batch inference destroys GPU utilization. The batching inflection point is workload-specific, but the principle is universal: below a threshold batch size, the workload is latency-bound and the GPU is underutilized by design. Above it, the workload is throughput-bound and utilization climbs. Inference routers that cannot identify which side of this inflection a given request falls on — and route accordingly — are routing all inference through a single cost model that is wrong for half the request volume. This connects directly to cost-aware routing in Cost-Aware Model Routing in Production.
Occupancy vs throughput — the SM tradeoff. SM occupancy is the ratio of active warps to the maximum number of warps an SM can support simultaneously. High occupancy is not always better. A kernel with high occupancy but poor memory access patterns (non-coalesced accesses, high cache miss rate) will underperform a lower-occupancy kernel with efficient memory access. The orchestration implication: GPU profile selection and batching strategy interact. A MIG partition sized for high occupancy on a small model may deliver lower effective throughput than a larger partition with better memory access behavior for the same model at a different batch size.
CUDA streams and concurrent execution. CUDA streams allow multiple kernels to execute concurrently on the same GPU — provided they don’t compete for the same SM or memory resources. For inference serving, CUDA stream concurrency enables multiple request batches to overlap execution on a single GPU, improving throughput per GPU without adding hardware. The failure mode is over-subscription: too many concurrent streams compete for SM resources, thrashing the SM scheduler and reducing throughput for all. Serving framework configuration — maximum concurrent requests per GPU, stream pool size — maps directly to this constraint.
CUDA makes hardware topology observable. The architectural consequence for infrastructure: NUMA behavior, NVLink latency, PCIe bandwidth ceiling, and HBM access patterns are all visible to CUDA workloads at runtime. When the infrastructure layer has not modeled these constraints explicitly — when placement authority is undefined and topology is whatever the scheduler happened to assign — CUDA workloads will discover the topology at runtime and perform accordingly. The discovery happens at the cost of throughput on every job that lands on suboptimal topology. Making topology a first-class infrastructure concern — enforced at the placement authority layer, before workloads run — converts that runtime discovery cost into a one-time architectural decision.
Topology-Aware Cluster Design
The physical layout of a GPU cluster is not a data center ops concern that can be addressed after the architecture is set. It is an architecture decision that determines the performance ceiling for every workload the cluster will ever run. Topology-aware cluster design means modeling NVLink domain boundaries, PCIe switch topology, NUMA node layout, and RDMA fabric paths before provisioning — and encoding those constraints into the scheduler before workloads arrive.
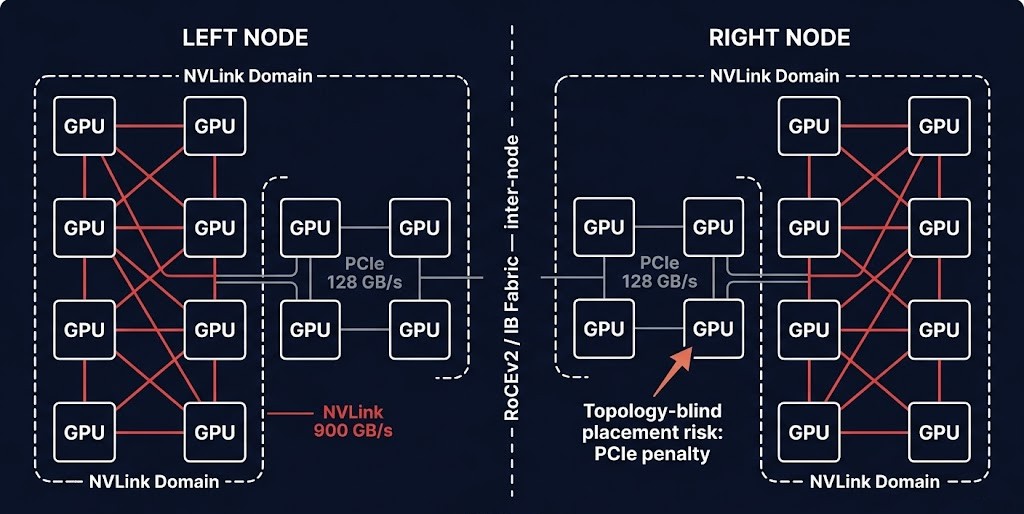
NVLink domains and the all-reduce constraint. In an H100 NVL configuration, up to eight GPUs share a single NVLink domain — a fully connected high-bandwidth fabric operating at 900 GB/s bidirectional. All-reduce operations within a NVLink domain are fast, deterministic, and low-latency. All-reduce operations that cross a NVLink domain boundary — requiring PCIe or network fabric traversal — are 5–7x slower per exchange. For distributed training where every step requires a full all-reduce pass across all participating GPUs, a job that spans NVLink domain boundaries pays that penalty on every gradient synchronization cycle. At 10,000 training steps, the cumulative throughput loss is not a rounding error.
The correct topology design co-locates training jobs within NVLink domains wherever possible. For jobs larger than a single NVLink domain — training runs requiring 16, 32, or 64+ GPUs — the inter-domain communication path must be a deterministic, low-latency fabric: RoCEv2 or InfiniBand with zero-oversubscription leaf-spine topology. The distinction between intra-domain (NVLink) and inter-domain (RDMA fabric) communication is a first-class design variable. Full fabric architecture for multi-node training — RDMA configuration, ECN signaling, adaptive routing, and the P99 latency constraints that govern gradient synchronization — is covered in Distributed AI Fabrics.
Gang scheduling and the straggler problem. Distributed training requires all participating pods to be scheduled simultaneously — if one pod cannot be placed, the job cannot start. Gang scheduling enforces this constraint: a job either places all pods or places none. Without gang scheduling, partial placement is possible — some pods start, wait for others, and hold GPU resources idle while the scheduler searches for compatible remaining placements. At scale, partial placement cascades: multiple partially placed jobs each hold GPUs that other jobs need, and the cluster deadlocks into a state where no jobs can start despite GPU availability.
The straggler problem is the runtime equivalent of placement failure. In distributed training, all nodes must complete gradient computation before the synchronization step advances. A single slow node — stalled on storage I/O, fabric congestion, or a preempted process — holds every other GPU in the job idle at the synchronization barrier. Straggler detection and replacement is a Day-2 training operations discipline, not a cluster design question. But cluster design determines straggler frequency: topology-aware placement that keeps training jobs on uniform hardware within a single NUMA and NVLink domain eliminates a class of straggler causes before they occur.
Distributed training converts the network into part of the compute layer. This is the architectural statement that bridges topology design to fabric governance. In a compute cluster without AI workloads, the network moves data. In a distributed training cluster, the network participates in execution — gradient synchronization, all-reduce, parameter exchange, and checkpoint I/O are all execution steps, not data movement events. A 15% fabric throughput degradation is not a network operations problem. It is a 15% training throughput degradation — a direct cost impact on every GPU-hour consumed by training jobs. This is why fabric authority is a first-class layer in the GPU Orchestration Authority Model, not a dependency on the networking team’s backlog.
Multi-Tenant GPU Infrastructure
Enterprise AI infrastructure is rapidly becoming internal cloud infrastructure. GPU clusters that started as single-team training resources are now shared platforms serving inference endpoints, fine-tuning jobs, batch processing pipelines, and experimental workloads from multiple teams simultaneously. The governance model that works for a single team fails at org scale — and the failure modes are specific to GPU infrastructure in ways that CPU-based multi-tenancy is not.
Noisy neighbor effects in GPU clusters. GPU memory and SM contention between co-located workloads is structurally different from CPU noisy neighbor effects. A CPU-bound workload consuming excess cycles degrades other workloads gradually and proportionally. A GPU workload that saturates HBM bandwidth or fills the L2 cache with its working set degrades other workloads on the same physical GPU abruptly and completely — memory stall behavior cascades across all tenants sharing the device. Software-level isolation (container namespaces, cgroups) does not prevent GPU memory pressure from affecting co-located workloads. MIG hardware partitioning is the only enforcement mechanism that creates genuine isolation boundaries at the memory and bandwidth layer.
Inference QoS and latency SLA enforcement. Multi-tenant inference serving introduces a QoS problem that single-tenant inference does not have: different services running on the same hardware must meet different latency SLAs, and a high-throughput batch inference job sharing a GPU with an interactive serving endpoint will violate the interactive endpoint’s latency guarantee under load. MIG partitioning separates them at the hardware layer. Without MIG, QoS enforcement requires either dedicated GPUs per service class — which defeats the economics of multi-tenancy — or serving framework-level scheduling that throttles batch workloads dynamically, which adds operational complexity and reduces batch throughput.
Scheduling starvation and burst vs reserved GPU policy. Multi-tenant clusters require explicit reservation and burst policies. Without them, high-priority jobs that arrive during peak load compete with lower-priority jobs on equal terms, and either high-priority jobs stall (starvation) or low-priority jobs are preempted without notice (thrash). The correct governance model separates GPU allocation into reserved capacity (guaranteed to specific workloads or teams regardless of cluster load) and burst capacity (available to any workload when reserved capacity is not fully consumed, but preemptible when reserved demand arrives). This maps to Kubernetes priority classes and preemption policies — but those policies must be defined as governance, not discovered as behavior after the first incident.
GPU memory leakage and container teardown guarantees. When a GPU-accelerated container terminates, CUDA context cleanup should release all device memory allocations. In practice, abnormal termination — OOM kills, SIGKILL during node drain, container runtime crashes — can leave orphaned GPU memory contexts that are invisible to the scheduler but consume device memory until the driver is reset or the node is rebooted. On MIG-partitioned nodes, a leaked context in one partition can prevent the partition from being reassigned without a full partition reset. Multi-tenant GPU platforms require explicit health checking at the device level — not just the container level — and node recovery procedures that include GPU context validation, not just pod rescheduling. Link to LLM Ops & Model Deployment for serving-layer multi-tenancy operations.
GPU Economics — Where Infrastructure Waste Actually Comes From
GPU infrastructure is expensive. H100 nodes run $30,000–$40,000/month on major cloud providers. On-premises clusters require CapEx in the millions before software and operations costs. At that price point, the economics of orchestration inefficiency are not abstract — they are measurable waste that accumulates daily.
GPU idle waste is an orchestration problem, not a demand problem. The most common source of idle GPU time is not insufficient workload. It is topology fragmentation, scheduler incompatibility, checkpoint locality mismatch, batch-size inefficiency, fabric congestion, and MIG fragmentation — all of which leave GPUs allocated but non-productive. A cluster that reports 80% allocation is not necessarily 80% productive. Allocation means GPUs are reserved. Utilization means they are executing. The gap between allocation and effective compute utilization is where infrastructure waste lives — and that gap is an orchestration governance failure, not a hardware or demand gap.
The false utilization problem. The metrics discussed earlier — 95% GPU utilization masking low SM occupancy and tensor core activity — translate directly into FinOps miscalculation. When GPU utilization is the primary cost efficiency metric and that metric reads healthy, the cost per productive compute unit compounds silently. A training job running at 95% GPU utilization but 25% tensor core utilization is delivering roughly one-quarter of the throughput per dollar the hardware is capable of. The bill reflects the hardware cost. The output reflects the orchestration quality. Traditional FinOps tooling cannot see this gap because it was built for CPU-based workloads where utilization maps more directly to productive work.
MIG economics — the local/global tradeoff. MIG improves utilization locally while reducing scheduling flexibility globally. That is not a flaw — it is the fundamental tradeoff of converting elastic accelerators into partitioned infrastructure. On a non-MIG node, a single large inference job can consume the full GPU and return it when complete, allowing the next job of any size to run. On a MIG-partitioned node, the partition profiles are fixed: a node partitioned as seven 1g.10gb slices cannot accommodate a workload requiring 40GB without reprovisioning. The economic benefit of MIG — improved cost-per-inference through partition utilization — comes with the operational cost of partition lifecycle management. The decision to partition is a commitment to the workload class those partitions serve. Organizations that partition nodes speculatively, without a stable workload profile to justify the specific profiles chosen, accumulate fragmentation debt: partitions that don’t match any arriving workload, GPUs that are partitioned but not schedulable.
The real GPU cost model. GPU clusters are not constrained primarily by GPU count. They are constrained by scheduling efficiency, topology compatibility, checkpoint throughput, and fabric congestion — all of which determine how much of the provisioned GPU capacity is accessible to productive workloads. Doubling GPU count in a cluster with scheduler fragmentation, topology-blind placement, and storage that cannot sustain checkpoint I/O does not double productive throughput. It doubles cost while the same orchestration bottlenecks persist at larger scale. The cost model for GPU infrastructure must account for effective utilization — the product of allocation rate, SM occupancy, tensor core activity, and fabric efficiency — not raw GPU-hours consumed. Getting to that number requires the instrumentation described in Inference Observability: Why You Don’t See the Cost Spike Until It’s Too Late.
Training and Inference Require Opposite Orchestration Models
Training and inference are not versions of the same workload running on the same hardware. They have structurally different performance requirements, different cost models, different failure modes, and — critically — different orchestration requirements. The operational pattern of running both on shared GPU hardware under a single orchestration model is the source of a large proportion of AI infrastructure problems. Understanding why they diverge, and what each requires from the orchestration layer, is prerequisite to designing a cluster that serves both well.
The orchestration consequence of this divergence is that the scheduler configuration, hardware profile, partitioning strategy, and observability instrumentation that serves training correctly will actively harm inference, and vice versa. Training requires gang scheduling — all pods or none. Inference requires independent pod scheduling — each request is isolated. Training requires topology cohesion — all GPUs in a NVLink domain. Inference requires partition isolation — MIG slices with hard memory boundaries. Training optimizes for aggregate throughput. Inference optimizes for P99 latency per request.
Running both workload classes on shared node pools under a unified scheduling policy produces a cluster that is suboptimal for both. Training jobs fragment the MIG partitions that inference needs. Inference workloads consume GPU memory that running training jobs need for checkpoints. Preemption policies that protect training jobs starve inference serving. The correct architecture separates them: dedicated node pools for training with topology-aware gang scheduling and zero-oversubscription fabric, and dedicated node pools for inference with MIG partitioning, QoS priority classes, and per-tenant resource quotas. The separation is not a resource luxury — it is the prerequisite for both workload classes performing correctly. The Training/Inference Split Is Now Hardware covers how GTC 2026 formalized this separation at the silicon level.
Operational Failure Modes
Decision Framework
| Scenario | Architecture Call | Primary Risk |
|---|---|---|
| Single-tenant distributed training | Topology-aware scheduler + gang scheduling + zero-oversubscription fabric | Fabric P99 violations on congested leaf switches; straggler accumulation without detection |
| Multi-tenant inference serving | MIG partitioning + QoS priority classes + per-tenant resource quotas | Profile mismatch between partition size and workload memory footprint at provision time |
| Mixed training + inference on shared cluster | Separate node pools + workload class labels + scheduler authority boundaries per pool | Shared GPU memory contention during training/inference overlap; preemption policy conflicts |
| On-premises sovereign AI | Local GPU Operator + private registry + air-gapped driver lifecycle management | Driver and CUDA toolkit version management without vendor-managed update path |
| Cloud GPU burst training | Spot/preemptible instances + checkpoint-aware training + gang scheduling with preemption tolerance | Checkpoint latency on preemption causing job restart cost exceeding spot savings |
| Multi-tenant internal AI platform | Scheduler layering policy + MIG isolation + burst/reserved GPU allocation split | Scheduling starvation on reserved allocations during burst events; fragmentation debt from speculative MIG provisioning |
GPU orchestration is the silicon and scheduling layer. The pages below cover what sits above it — fabric governance, inference architecture, model operations, and retrieval — and the learning path that sequences the full stack.
Architect’s Verdict
GPU orchestration is a scheduling problem, not a hardware problem. The organizations that provision the most GPU capacity and see the least return from it are not buying the wrong hardware — they are applying the wrong governance model. Placement is left to scheduler defaults that cannot see topology. Partitioning is set once and never reviewed as workloads change. Scheduling authority is undefined across the multiple orchestration systems that accumulate in any cluster that grows organically. Fabric is treated as a network concern separate from compute performance. The GPU Orchestration Authority Model exists to make those four governance layers explicit — placement, partitioning, scheduling, fabric — before workloads arrive, because they cannot be corrected efficiently after the fact.
The metrics problem is equally consequential. A 95% GPU utilization figure is not an architecture health signal. It is a kernel scheduling signal. SM occupancy, tensor core activity, NVLink throughput, and memory controller pressure are the metrics that reveal whether a cluster is working or merely running. Organizations that optimize GPU ROI against a single utilization number are measuring the wrong thing, and the cost consequence of that measurement error compounds every month. The instrumentation investment required to see the right metrics is small relative to the waste it reveals.
Modern AI infrastructure is governed less by silicon capability than by orchestration authority. The organizations extracting the highest value from GPU clusters are not the ones with the largest deployments — they are the ones that made placement, partitioning, scheduling, and fabric behavior explicit architectural decisions before the workloads arrived. The cluster that runs at 80% effective compute utilization on 100 GPUs outperforms the cluster that runs at 40% effective utilization on 200. The difference is not hardware. It is governance.
You’ve Read the Architecture.
Now Validate Whether Your Cluster Holds.
GPU clusters that look healthy by standard metrics — high utilization, low error rate, full allocation — frequently have topology-blind placement, fragmented MIG configurations, and scheduler authority conflicts that are invisible until a training job underperforms or an inference bill arrives 40% over forecast. The audit identifies the constraint before it compounds.
AI Infrastructure Audit
Vendor-agnostic review of your GPU infrastructure stack — topology constraints and placement governance, scheduler authority boundaries, MIG configuration and workload class mapping, fabric architecture, and RDMA path validation.
- > GPU topology constraint and placement authority review
- > Scheduler layering and authority boundary diagnosis
- > MIG configuration and workload class mapping validation
- > Fabric architecture and RDMA path review
Architecture Playbooks. Every Week.
Field-tested blueprints from real GPU infrastructure environments — topology placement failures, MIG fragmentation case studies, scheduler authority collapse diagnostics, and the inference cost architecture patterns that keep production AI within budget.
- > GPU Cluster Topology & Placement Governance
- > MIG Partitioning & Multi-Tenant GPU Patterns
- > Inference Cost Runaway & Runtime Budget Enforcement
- > Scheduler Fragmentation Collapse Case Studies
Zero spam. Unsubscribe anytime.
Frequently Asked Questions
Q1: What is GPU orchestration in Kubernetes?
A: GPU orchestration in Kubernetes is the discipline of managing GPU resource allocation, topology-aware placement, and scheduling coordination across a cluster of GPU-accelerated nodes. It extends beyond basic device plugin resource requests to include NVLink domain awareness, NUMA-aligned placement, MIG partition management, gang scheduling for distributed jobs, and coordination across multiple scheduling systems. The default Kubernetes scheduler is topology-blind — GPU orchestration adds the governance layer that makes physical hardware topology a first-class scheduling constraint.
Q2: When should you use MIG partitioning versus shared GPU access?
A: MIG is the right call when inference workloads have predictable, stable memory footprints that fit standard partition profiles; when multi-tenant isolation is required at the hardware boundary rather than software boundary; when per-workload cost attribution is a FinOps or chargeback requirement; or when different services on the same hardware must meet different latency SLAs. Avoid MIG for training workloads — MIG instances cannot participate in NVLink all-reduce and have reduced memory bandwidth per slice. The fundamental tradeoff: MIG improves utilization locally while reducing scheduling flexibility globally. Commit to partition profiles only when you have a stable workload profile to match them against.
Q3: What is topology-aware GPU scheduling and why does it matter?
A: Topology-aware GPU scheduling places GPU workloads based on physical hardware relationships — NVLink domain membership, NUMA zone, PCIe switch topology, and RDMA path availability — not just GPU count. It matters because distributed training performance is governed by the bandwidth available between GPUs during all-reduce operations. Two GPUs connected by NVLink exchange gradients at 900 GB/s. Two GPUs connected only by PCIe exchange them at 128 GB/s. A topology-unaware scheduler can assign a training job to the slower topology without any indication that a better placement exists. The throughput loss — 15–40% depending on all-reduce frequency — is silent and persistent.
Q4: How does NVLink affect distributed training architecture?
A: NVLink creates a high-bandwidth, low-latency interconnect domain between GPUs within the same physical node or NVLink switch group. For distributed training, NVLink is the prerequisite for efficient all-reduce — the gradient synchronization operation that all GPUs in a training job must complete at every training step. A training job whose GPUs share an NVLink domain completes all-reduce in microseconds. A job that crosses NVLink domain boundaries and falls back to PCIe or network fabric pays a 5–7x bandwidth penalty per exchange. Training architecture should maximize intra-NVLink-domain parallelism for jobs that fit within a domain, and use deterministic RDMA fabric (RoCEv2 or InfiniBand) for jobs that span multiple nodes.
Q5: What is the difference between GPU utilization and SM utilization?
A: GPU utilization measures whether any kernel is currently scheduled and running on the GPU — it is a binary active/idle signal averaged over time. SM (Streaming Multiprocessor) utilization measures the compute occupancy of the SMs themselves — how many of the GPU’s parallel processing units are executing warps versus stalling on memory access. A GPU can report 95% utilization (kernels are running) while SM utilization sits at 20% (most warps are stalled waiting for memory). This gap — high GPU utilization, low SM occupancy — indicates a memory-bound workload where the GPU is producing far less compute output per dollar than the utilization figure suggests. Tensor core utilization adds the third dimension: whether the AI-specific acceleration hardware is being used, or whether work is routing to general CUDA cores instead.
Q6: What causes Scheduler Fragmentation Collapse in GPU clusters?
A: Scheduler Fragmentation Collapse occurs when a cluster has available GPUs but no schedulable topology exists for the arriving job. Common causes: MIG partitions fragmented across multiple nodes in incompatible profiles (a job needing 3g.40gb slices on a node fully partitioned as 1g.10gb); NVLink islands partially occupied by unrelated workloads (a training job requiring 8 co-located NVLink-connected GPUs cannot run when 4 of the 8 are allocated to independent inference jobs); or distributed training requiring gang-scheduled co-placement when only scattered individual GPUs are available. The cluster reports available GPU capacity. The job queue grows. No error surfaces. Diagnosis requires topology-aware cluster state visualization, not just resource utilization metrics.
Q7: When does on-premises GPU infrastructure outperform cloud GPU economics?
A: The break-even threshold is approximately 60–70% consistent GPU utilization over a 12–18 month horizon. Below that, cloud economics win — on-demand access without capital commitment, burst capacity for unpredictable training runs, and no driver lifecycle management overhead. Above it, owned infrastructure typically delivers better price-performance. The calculation also includes data gravity: if the training dataset is large, stable, and already on-premises, the cost of cross-region data transfer at cloud GPU training scale can shift the break-even point significantly lower. Regulatory constraints and data sovereignty requirements are independent of the utilization calculation — they enforce on-premises placement regardless of economics.