KUBERNETES CLUSTER ORCHESTRATION
CONTROL LOOPS. DESIRED STATE. PRODUCTION REALITY.
Kubernetes cluster orchestration is not container management. That description understates what Kubernetes actually is and misframes every architectural decision that follows from it.
Kubernetes is a distributed systems control plane. It does not run your applications — it continuously enforces the state you declared. The scheduler places workloads. The controller manager reconciles drift. The API server is the single source of truth. Every component in the cluster exists to close the gap between what you specified and what is actually running. That loop never stops.
The organizations that struggle with Kubernetes are not the ones who lack technical knowledge. They are the ones who bring the wrong mental model. They treat Kubernetes like a smarter Docker host, or a more complex deployment script, or a managed service that handles complexity for them. Kubernetes handles none of those things. It enforces intent — and it enforces it perfectly regardless of whether the intent is correct.
his guide covers the control plane model, the six architectural layers, where Kubernetes actually fails, scheduling and resource management, networking, storage, Day-2 operations, cost physics, cluster topologies, and the platform engineering model that makes Kubernetes usable at organizational scale.
If you don’t understand the control loop, you don’t understand Kubernetes.
The Kubernetes Illusion
Teams adopt Kubernetes believing it gives them control. It gives them a control loop — and that distinction changes everything about how failures happen.
A control loop is not a safety net. It is an enforcement mechanism. Kubernetes will scale your misconfigured deployment to fifty replicas with the same consistency it scales a correct one. It will continuously reschedule a crashlooping pod. It will enforce a NetworkPolicy that blocks the traffic you needed. It will evict your workloads when resource limits are set incorrectly. The loop does not evaluate whether your desired state is correct — it enforces it.
This is the Kubernetes illusion: the platform looks like it is managing your systems when it is actually mirroring your decisions back at you at cluster scale. The control loop is neutral. It does not correct mistakes — it amplifies them consistently and at speed.
Every section in this guide exists to close the gap between the illusion and the reality. The architecture sections explain what Kubernetes actually enforces. The failure sections document what happens when the enforcement meets bad configuration. The Day-2 section gives you the diagnostic protocol when the loop is enforcing something you did not intend.
What Kubernetes Cluster Orchestration Actually Is
Kubernetes is three things simultaneously: a distributed key-value store with an API in front of it, a set of control loops that watch that store and take action, and a scheduling engine that decides where workloads run. Everything else — the ecosystem, the tooling, the operators — is built on top of those three primitives.
The control plane makes decisions. The data plane executes them. These two layers are architecturally distinct and must be treated as such. Control plane health determines whether your cluster can make decisions at all. Data plane health determines whether those decisions are executed correctly. A degraded control plane produces scheduling failures and policy enforcement gaps. A degraded data plane produces pod failures and network issues. Conflating them is the source of most Kubernetes diagnostic confusion.
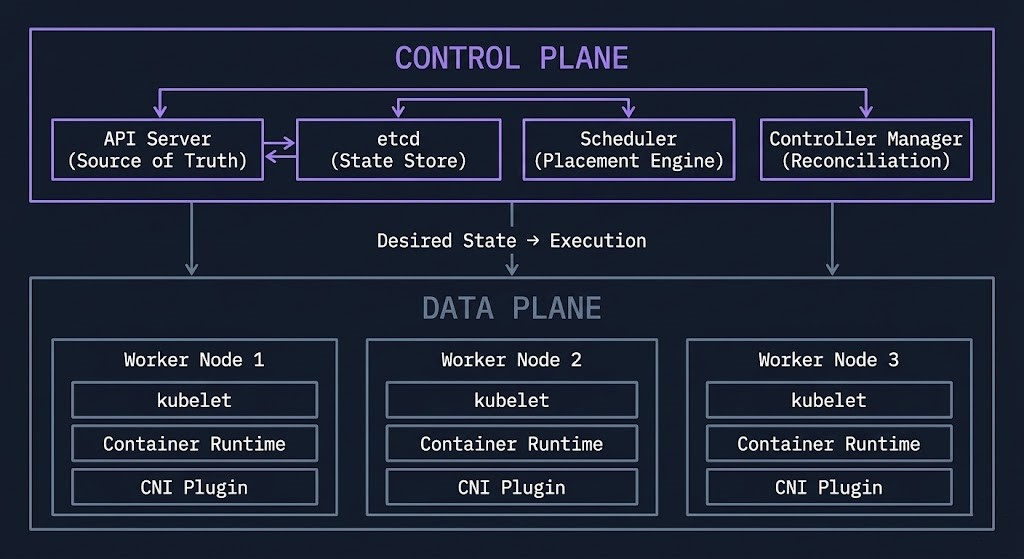
The control loop is the architectural primitive that makes Kubernetes genuinely different from previous orchestration systems. A controller watches the API server for changes to its resource type. When it detects a difference between desired and actual state, it takes action to close the gap. The Deployment controller ensures the correct replica count exists. The Node controller marks unavailable nodes. The Service controller manages load balancer endpoints. These loops run continuously — not on demand — which is what makes Kubernetes self-healing rather than manually managed
Understanding which controller governs which resource is the first diagnostic skill Kubernetes demands. When a Deployment is stuck, the problem is in the Deployment controller’s reconciliation loop — or in the scheduler it delegates placement to — or in the kubelet that executes the pod spec on the selected node. The failure chain is deterministic. Finding it requires knowing which loop to inspect.
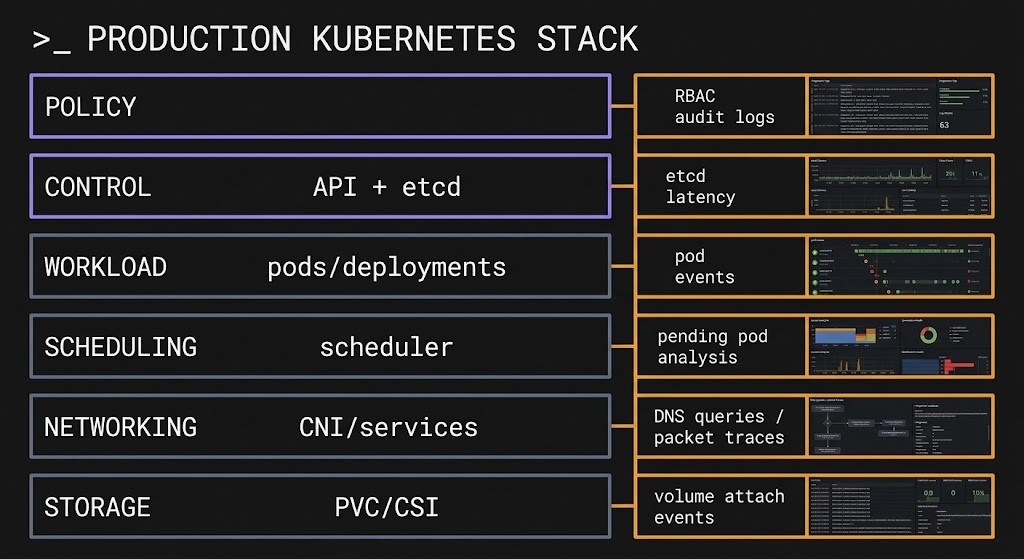
The Kubernetes Cluster Orchestration Architecture Stack
Kubernetes is a six-layer architecture. Each layer has distinct failure modes. They are interdependent, not modular — a failure at one layer produces symptoms at a different layer, which is why Kubernetes diagnostics are harder than they initially appear.
The interdependency matters operationally: a resource request set too high at Layer 3 produces scheduler fragmentation at Layer 4 that looks like capacity exhaustion at Layer 2. A NetworkPolicy misconfiguration at Layer 5 looks like an application timeout at Layer 3. Kubernetes diagnostics require tracing the failure chain across layers — not just observing the symptom layer.
Where Kubernetes Cluster Orchestration Actually Fails
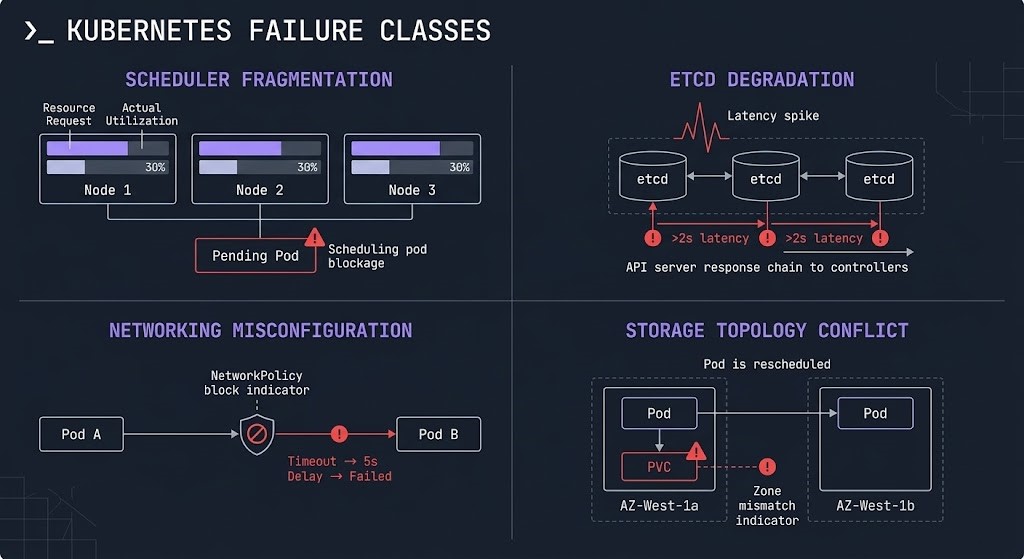
Most Kubernetes failures are not Kubernetes failures. They are configuration failures that Kubernetes enforces consistently. Understanding the four failure classes — and which layer they originate from — is the prerequisite for diagnostic speed.
Each failure class has a diagnostic protocol. The Kubernetes Day-2 failure analysis documents five real-world production incidents — each mapping to a specific failure class — and the exact diagnostic sequence that surfaces the root cause. The pattern is consistent: the symptom layer is never the failure layer. Kubernetes fails deterministically, which means it can be diagnosed deterministically.
Scheduling & Resource Management — Where Clusters Actually Fail
The scheduler is the component teams understand least and misconfigure most. It has one job — given a new pod with no assigned node, select the optimal placement — but the inputs to that decision create failure modes that are invisible until they compound.
The scheduler makes placement decisions based on resource requests, not actual utilization. This is the most important sentence in Kubernetes resource management. A node with 16 CPU cores where eight pods each request 1.5 CPU appears full to the scheduler at 12 vCPU requested — even if actual CPU utilization across those pods is 2 vCPU. The remaining 4 cores are invisible to the scheduler because no pod has requested them. New pods cannot be scheduled to this node regardless of actual headroom.
Overcommit strategy is the deliberate decision to set limits higher than requests — accepting that not all pods will hit their limits simultaneously. This improves bin-packing efficiency at the cost of eviction risk during traffic spikes. The correct overcommit ratio depends on workload variance. Batch jobs with predictable peak load support aggressive overcommit. Latency-sensitive services require conservative ratios.
Pod eviction behavior is the consequence of overcommit under pressure. When a node’s actual memory consumption approaches its capacity, kubelet evicts pods based on QoS class: BestEffort pods (no requests or limits) first, then Burstable pods (requests < limits), then Guaranteed pods (requests == limits). The eviction order is deterministic — which means you can design for it by setting QoS classes deliberately rather than accidentally.
The Kubernetes scheduler fragmentation failure — a cluster that appears full but has abundant actual capacity — is documented in detail in the scheduler diagnostic guide. The diagnosis requires comparing requested capacity against actual utilization at the node level, not the cluster aggregate level. Aggregate utilization can look healthy while individual nodes are fragmented.
Networking — The Hidden Complexity Layer
Kubernetes makes a single networking assumption that drives everything else: every pod can reach every other pod by default. No NAT. No firewall rules. Flat network. This default is both the feature that makes service discovery simple and the security gap that NetworkPolicies exist to close.
The CNI plugin is the component that makes the flat network real on each node — assigning IP addresses to pods, programming routing rules, and enforcing NetworkPolicies. CNI choice is an architectural decision with long-term operational consequences. Calico, Cilium, Flannel, and Weave each implement the flat network differently, with different performance characteristics, different NetworkPolicy semantics, and different observability capabilities.
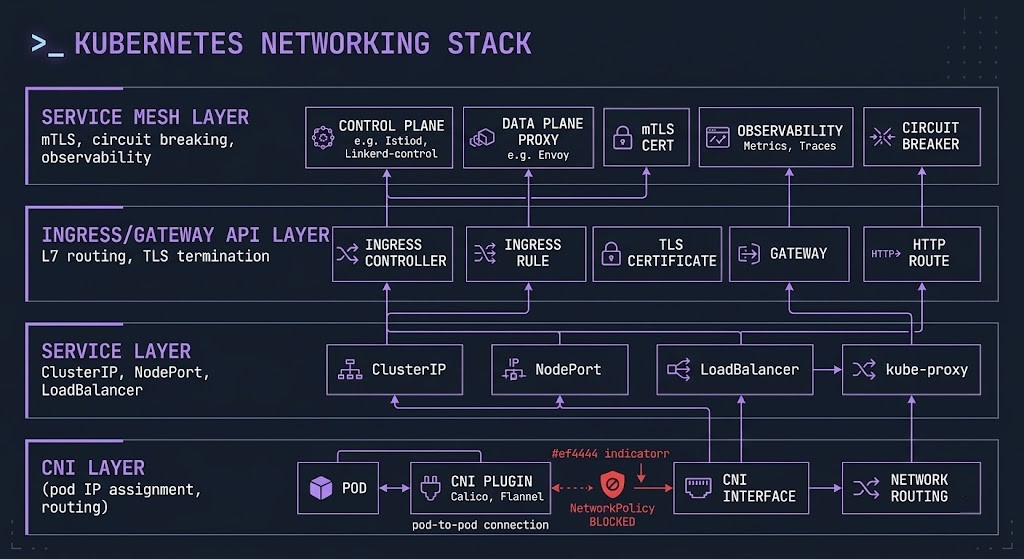
Service discovery operates through the Service abstraction — a stable virtual IP backed by kube-proxy (or eBPF) routing rules that load balance across the pod endpoints matching a selector. The Service IP is stable; pod IPs are ephemeral. DNS resolution via CoreDNS resolves service names to ClusterIPs. CoreDNS health is therefore a dependency for every service-to-service call in the cluster — a degraded CoreDNS produces intermittent DNS failures that look like application timeouts.
The Ingress to Gateway API migration is the current inflection point in Kubernetes networking architecture. Ingress was designed for simple HTTP routing. The Gateway API provides a role-oriented, expressive model for L4 and L7 traffic management that separates infrastructure concerns (Gateway) from application concerns (HTTPRoute). The migration guide covers the architectural shift and the operational steps for clusters still running Ingress controllers.
Service mesh is the layer Kubernetes networking deliberately does not include. Kubernetes stops at connectivity — it ensures pods can reach each other. It does not enforce mTLS between services, implement circuit breakers, provide distributed tracing injection, or manage retry logic. That is the service mesh responsibility. The service mesh vs eBPF architecture decision covers whether sidecar-based service meshes (Istio, Linkerd) or kernel-level eBPF implementations (Cilium) are the right model for your environment.
Storage & State — Where Kubernetes Earns or Fails
The cloud native operational model was designed for stateless workloads. Stateful workloads expose the gaps — and Kubernetes has gaps around storage that are not obvious until they surface in production at the worst possible moment.
Stateless pods are trivially rescheduled. The scheduler places a new instance anywhere in the cluster. No data migration. No coordination. The new instance is identical to the old one because state lives outside the compute layer. Stateful pods cannot be rescheduled arbitrarily — a database pod evicted from one node cannot restart on another node without its data.
StatefulSets provide ordered deployment, stable network identities, and persistent volume claims that follow pods across rescheduling events. They introduce operational complexity that Deployments do not have. Scale-down of a StatefulSet requires careful consideration of quorum before the last replica is removed. The stable network identity — pod-0, pod-1, pod-2 — is load-bearing for distributed systems that use hostname-based peer discovery.
The PVC node affinity failure is the most common stateful workload failure in multi-AZ clusters. Block storage is zonal — an EBS volume in us-east-1a cannot be attached to a node in us-east-1b. The scheduler does not know which zone a pod’s PVC exists in by default. When a pod is rescheduled due to node failure or manual drain, the scheduler may place it in a different zone. The pod enters ContainerCreating and stays there. The storage diagnostic guide documents the exact failure signature and resolution — including the topology-aware volume provisioning configuration that prevents it.
Day-2 Operations Reality — The Kubernetes Cluster Orchestration Method
Day-1 Kubernetes is provisioning a cluster and deploying workloads. Day-2 is everything that happens after — upgrades, capacity management, incident response, drift detection, and the diagnostic work that comes when the cluster stops behaving as expected. Most Kubernetes content covers Day-1. Day-2 is where clusters actually spend their operational life.
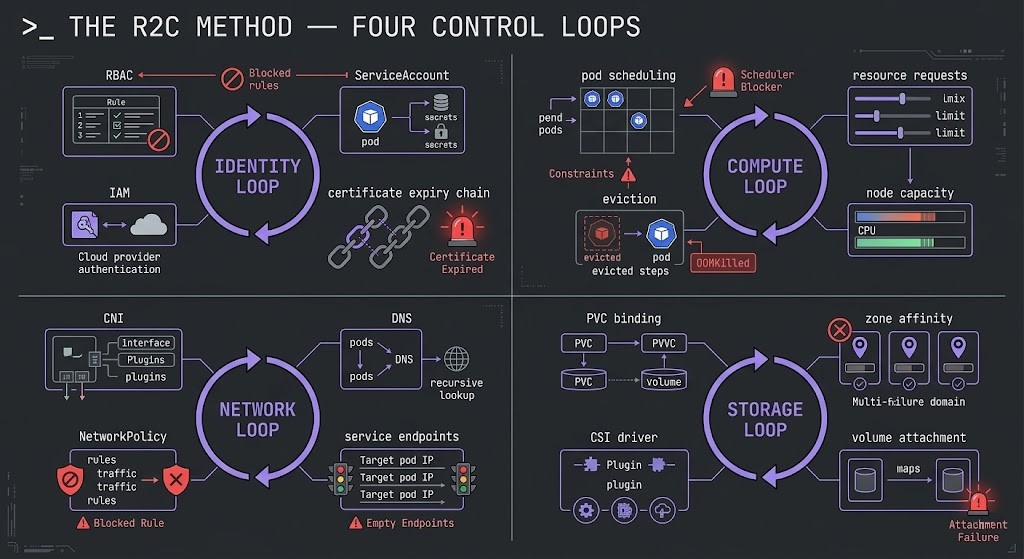
The Racl2Cloud Method organizes Kubernetes diagnostics around four control loops: Identity, Compute, Network, and Storage. Every production Kubernetes failure traces to degradation in one of these loops. The diagnostic protocol starts by identifying which loop is degraded — not by searching logs randomly across the cluster.
The Day-2 failure analysis documents five specific production incidents — each with the initial symptom, the misleading first diagnosis, and the actual root cause that the control loop framework surfaces. The pattern is consistent across all five: the symptom layer is never the failure layer. The Kubernetes Rack2Cloud Method guide covers the full diagnostic protocol including the kubectl command sequences for each loop.
The Rack2Cloud Kubernetes Day-2 Operations repository is the companion diagnostic library to this page — containing the failure signature library, diagnostic protocols, and kubectl sequences for every control loop. Access it directly or navigate through the Canonical Architecture Specifications page.
Upgrade management is the Day-2 discipline teams underestimate most. Kubernetes releases occur every four months. Each release deprecates APIs, changes default behavior, and introduces new capabilities that operators need to understand before upgrading production clusters. The upgrade physics guide covers rolling maintenance design for clusters that cannot tolerate downtime — the architectural decisions that make zero-downtime Kubernetes upgrades deterministic rather than hopeful.
Shared Responsibility — Platform vs Architecture
Managed Kubernetes removes infrastructure burden. It does not remove architectural responsibility. This distinction is the most consistently misunderstood aspect of running Kubernetes on EKS, GKE, or AKS.
- [+] Control plane provisioning, availability, and patching
- [+] etcd backup and restore (with caveats per provider)
- [+] Node OS patching via managed node groups
- [+] Integration with cloud provider IAM and load balancers
- [!] Workload design — resource requests, limits, health probes, QoS
- [!] Networking model — CNI selection, NetworkPolicy, service mesh
- [!] Security posture — RBAC, pod security, admission policy, image signing
- [!] Scaling strategy — HPA tuning, cluster autoscaler configuration, node group sizing
- [!] Observability — distributed tracing, metrics collection, log aggregation
- [!] Cost efficiency — node utilization, right-sizing, spot instance strategy
The implication is direct: choosing EKS over self-managed Kubernetes does not change your architecture responsibilities. You still own every decision about how workloads are configured, how traffic is managed, how security policies are enforced, and how costs are controlled. The managed plane handles infrastructure operations. Architectural decisions remain entirely yours.
Cost Physics — Kubernetes Makes Waste Invisible, Not Impossible
Kubernetes can reduce infrastructure cost significantly. It can also make waste invisible at a scale that traditional infrastructure cannot match. The outcome depends entirely on whether autoscaling is correctly configured and whether resource requests accurately reflect actual consumption.
The most common Kubernetes cost trap is the over-provisioned cluster with autoscaling disabled. Teams provision nodes for peak load plus 30% headroom, disable the cluster autoscaler because they don’t trust it, and run at 20-25% utilization. The cluster bill is 4-5x what it would be with correct autoscaler configuration. The waste is invisible because Kubernetes abstracts the underlying nodes — you see pod utilization, not node waste.
The cluster autoscaler must be configured with appropriate scale-down thresholds, node group sizing, and pod disruption budgets to capture the utilization efficiency Kubernetes promises. Scale-down is more operationally significant than scale-up — the autoscaler needs to be able to drain nodes without violating application availability requirements.
Cluster Topologies — Single, Multi-Cluster, and Edge
The cluster topology decision determines blast radius, operational overhead, and compliance posture. Most organizations start with one cluster and discover its limitations through incidents rather than planning.
The multi-cluster reality most organizations discover too late: cluster count compounds operational overhead faster than it compounds blast radius protection. At three clusters, the overhead is manageable. At fifteen clusters without centralized fleet management tooling, upgrade coordination, policy governance, and observability aggregation become full-time engineering responsibilities. Size your cluster count to your operational capacity — not just your isolation requirements.
Kubernetes Is Not the Platform — The Platform Engineering Layer
Raw Kubernetes is operationally powerful and cognitively expensive. A developer who needs to deploy a service should not need to understand PodDisruptionBudgets, HorizontalPodAutoscalers, NetworkPolicies, and ServiceAccounts to get a workload running safely. Platform engineering exists to close that gap.
The internal developer platform (IDP) is the abstraction layer between Kubernetes and the engineering teams consuming it. It provides curated, opinionated interfaces to cluster capabilities — enforcing organizational standards around security, resource allocation, and observability while reducing the cognitive overhead for product teams. Backstage is the most widely adopted open-source IDP framework, providing a service catalog, documentation portal, and plugin architecture that integrates Kubernetes, CI/CD, monitoring, and cloud APIs into a single interface.
The golden path is the platform engineering mechanism that matters most operationally: a pre-configured, policy-compliant deployment path that satisfies organizational requirements by default. A team following the golden path does not configure NetworkPolicies, ResourceQuotas, or observability instrumentation — the platform applies them automatically. Deviation from the golden path requires explicit justification, creating governance checkpoints without manual approval queues.
The distinction between Kubernetes and the platform built on it matters for organizational planning. Kubernetes expertise is the prerequisite. Platform engineering is the multiplier. Organizations that expose raw Kubernetes to all product teams without an abstraction layer will find that Kubernetes expertise becomes a bottleneck rather than a capability — every team needs the same depth of knowledge to deploy safely, and that knowledge is expensive to distribute and maintain.
Infrastructure as Code and drift enforcement are the operational layer that keeps the platform consistent as it scales. The IaC strategy guide covers the GitOps model for cluster state management — the same declarative reconciliation model that governs Kubernetes workload scheduling applied to the platform configuration layer. The configuration drift post covers how drift detection prevents the platform from silently diverging from its declared state.
Workload Decision Framework
When Kubernetes Cluster Orchestration Is the Right Call
Kubernetes provides the isolation boundaries — namespaces, RBAC, NetworkPolicies, ResourceQuotas — that allow teams to operate independently on shared infrastructure. The platform team builds the platform. Product teams consume it without needing Kubernetes expertise to deploy safely.
When teams release multiple times per day, automated rolling updates, health checking, and rollback capabilities have compounding operational value. The automation investment returns directly proportional to deployment frequency — the more often you deploy, the more the platform earns its complexity cost.
When different services have materially different load profiles — search is CPU-intensive and spiky, checkout is latency-sensitive and bursty, batch jobs run overnight — selective scaling at the service level reduces cost significantly compared to scaling a monolith for the combined peak.
The same Kubernetes manifest runs on EKS, GKE, AKS, and on-premises clusters. Portability is real, not theoretical, when the abstraction layer is the Kubernetes API. For workloads that must run across providers, on-premises, and at the edge without re-platforming, Kubernetes provides the substrate.
When to Consider Alternatives
A team of five running two services that deploy monthly does not need Kubernetes. The platform engineering overhead costs more in engineering time than the operational efficiency returns. Kubernetes is not a starting point — it is an optimization model for teams and systems that have grown beyond what simpler approaches can handle.
Kubernetes is a force multiplier — or a complexity amplifier. Without established CI/CD practices, without observability culture, and without engineers who understand control loops, Kubernetes adds complexity faster than it adds velocity. Build operational discipline first. Then Kubernetes scales it.
Dynamic scheduling conflicts with fixed-topology requirements. Workloads with sub-millisecond latency requirements or strict NUMA affinity needs require configuration complexity that approaches traditional infrastructure. The scheduling flexibility that makes Kubernetes valuable becomes overhead for latency-critical workloads.
Containerizing a monolith and running it on Kubernetes is not cloud native. It is a lift-and-shift with additional operational overhead. The Kubernetes benefits require workloads designed for horizontal scaling, statelessness, and independent deployability. The Kubernetes VMware exit ramp covers the transition path for teams moving from VM-based architectures.
Decision Framework
You have the control plane model, the failure framework, and the Day-2 diagnostic protocol. The pages below cover the security layer that runs beneath Kubernetes, the networking layer above it, and the cloud platforms that host it.
Architect’s Verdict
Kubernetes is the Linux of distributed systems — powerful, flexible, composable, and easy to misconfigure at scale. The teams that succeed with it are not the ones with the most Kubernetes knowledge. They are the ones who understand what the control loop enforces and design their systems to work with that enforcement rather than against it.
The control loop is neutral. It enforces desired state with complete consistency — which means misconfiguration scales perfectly. An incorrect resource request produces scheduler fragmentation across every node in the cluster. A missing NetworkPolicy creates a security gap in every namespace that doesn’t have one. A StatefulSet scaled down without quorum consideration produces data availability failures that are completely predictable once you understand the storage loop.
The implication for production operations is direct: Kubernetes diagnostic work is deterministic. You are not hunting for random failures — you are tracing the failure chain through the six architectural layers to find where the desired state diverged from the intended state. The Rack2Cloud Method gives you the four control loops as the diagnostic framework. The canonical specifications repository gives you the failure signature library. Every production failure has a chain, and every chain has a start.
The specific reason Kubernetes fails in most organizations is not the platform. It is the gap between what teams think Kubernetes manages and what it actually enforces. That gap closes with control loop literacy — not with more features, not with a different distribution, and not with a managed service that abstracts the complexity you need to understand to operate it safely.
Design for the control loop. Instrument every layer. Treat etcd as critical infrastructure. Set resource requests at P95 actual utilization. Build the platform engineering layer before distributing Kubernetes access. And run failure drills before incidents teach you what the loop does under pressure.
You Know the Scheduler.
Now Diagnose What’s Breaking Your Cluster.
Scheduler fragmentation, resource contention, IP exhaustion, PVC affinity failures — Kubernetes operational problems rarely announce themselves clearly. They surface as Pending pods, degraded performance, and cluster behavior that doesn’t match the resource metrics. The triage session finds the actual constraint.
Kubernetes Cluster Audit
Vendor-agnostic review of your Kubernetes cluster — scheduler configuration, resource request and limit design, node pool sizing, networking topology, autoscaler configuration, and the Day-2 operational patterns that determine whether your cluster is stable or accumulating silent debt.
- > Scheduler behavior and resource fragmentation audit
- > Resource request/limit design and node sizing
- > HPA/VPA autoscaler configuration review
- > Networking, IP range planning, and CNI audit
Architecture Playbooks. Every Week.
Field-tested blueprints from real Kubernetes production environments — scheduler fragmentation diagnostics, GKE IP exhaustion case studies, VPA and HPA failure patterns, and the cluster operational intelligence that keeps production Kubernetes stable at scale.
- > Kubernetes Day-2 Failure Diagnostics
- > Autoscaler Architecture & Resource Control
- > GKE Operations & IP Management
- > Real Failure-Mode Case Studies
Zero spam. Unsubscribe anytime.
Frequently Asked Questions
Q: What is Kubernetes cluster orchestration and how does it differ from container management?
A: Kubernetes cluster orchestration is a distributed systems control plane that continuously enforces declared desired state across a cluster of nodes. Container management describes what Docker does — packaging and running containers on a single host. Kubernetes operates at the cluster level: scheduling workloads across nodes, reconciling actual state against desired state, enforcing network policy, and managing the lifecycle of every resource in the cluster. The distinction matters architecturally because Kubernetes does not manage applications — it enforces configurations. Misconfigured desired state is enforced as consistently as correct desired state.
Q: Is Kubernetes overkill for most teams?
A: For small teams with stable workloads and infrequent deployments, yes. The platform engineering overhead — cluster operations, observability stack, RBAC configuration, upgrade management — costs more in engineering time than it returns for low-change environments. Kubernetes is an optimization model for teams and systems that have grown beyond what simpler approaches handle. The break-even appears at roughly ten or more services with meaningfully different load profiles, multiple teams deploying independently, or portability requirements across environments. Below that threshold, managed VMs or PaaS services are simpler and cheaper to operate.
Q: EKS vs self-managed Kubernetes — what actually changes?
A: Managed Kubernetes (EKS, GKE, AKS) handles control plane operations — provisioning, availability, patching, and etcd management. Self-managed Kubernetes adds those responsibilities to your team. What does not change regardless of choice: workload design, resource configuration, networking model, security posture, scaling strategy, and cost management. The architectural decisions that determine whether Kubernetes works correctly in production are all in the architecture responsibility column — not the platform responsibility column. Managed Kubernetes removes infrastructure burden, not architectural responsibility.
Q: How many clusters should you run?
A: The minimum that satisfies your isolation requirements. Common patterns: one cluster per environment (prod/staging/dev), or one cluster per compliance boundary, or one cluster per team for large organizations. The trap is treating cluster count as a safety measure without accounting for operational overhead — each additional cluster requires independent upgrade management, policy governance, and observability aggregation. At fifteen clusters without centralized fleet management tooling, the overhead outweighs the isolation benefit for most organizations.
Q: What breaks first in production Kubernetes clusters?
A: Scheduling fragmentation is the most common first production failure — nodes that appear full to the scheduler while running at low actual utilization, caused by resource requests set higher than actual consumption. The second most common is etcd latency degradation from insufficient disk I/O on control plane nodes, which produces slow kubectl responses and delayed scheduling decisions that look like application issues. Both are configuration failures that Kubernetes enforces consistently — they are predictable and preventable with correct resource configuration and etcd monitoring.
Q: How does Kubernetes impact infrastructure cost?
A: Kubernetes can reduce cost significantly through bin-packing efficiency, autoscaling, and spot instance viability — but only when autoscaling is correctly configured and resource requests accurately reflect actual consumption. The most common outcome for teams new to Kubernetes is higher cost than traditional infrastructure: clusters provisioned for peak load, autoscaler disabled, running at 20-25% utilization while billing at 100%. The cost model improves once the cluster autoscaler is tuned, resource requests are right-sized to P95 actual utilization, and spot instances are enabled for fault-tolerant workloads.