Inference Observability: Why You Don’t See the Cost Spike Until It’s Too Late
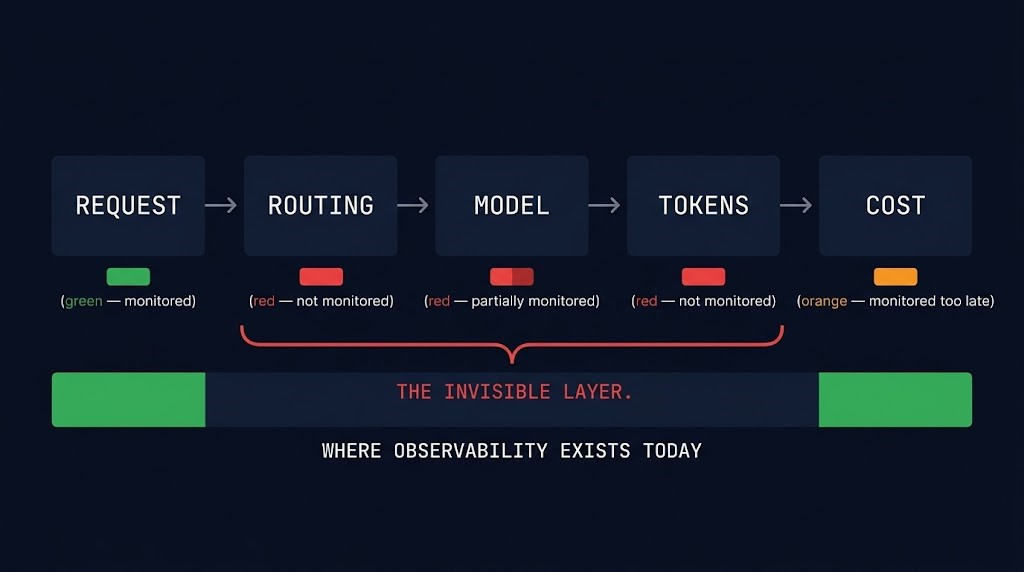
The bill arrives before the alert does. Because the system that creates the cost isn’t the system you’re monitoring. Inference observability isn’t a tooling problem — it’s a layer problem. Your APM stack tracks latency. Your infrastructure monitoring tracks GPU utilization. Neither one tracks the routing decision that sent a thousand requests to your most expensive model, or the prompt length drift that silently doubled your token consumption over three weeks. By the time your cost alert fires, the tokens are already spent.
This is Part 4 of the AI Inference Cost series. Part 1 established why inference cost behaves like egress — unpredictable, invisible until it hits. Part 2 covered execution budgets — the runtime controls that cap spend before it cliffs. Part 3 covered cost-aware model routing — getting requests to the right model at the right cost. None of those controls work without the feedback loop that makes them visible. That’s what this post covers.
The Visibility Gap
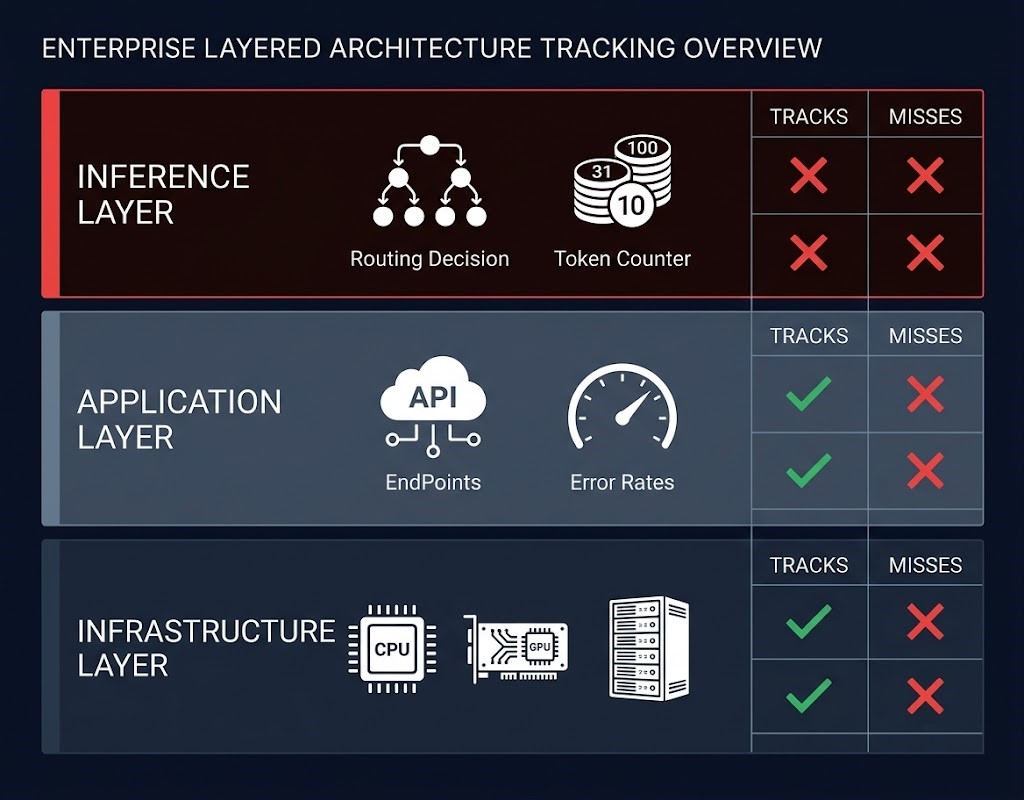
Inference cost is generated at the decision layer. Routing decisions, token consumption, model selection, retry behavior — these are the variables that determine what you pay. But most observability exists at the infrastructure layer: CPU utilization, GPU memory, API latency, error rates. The gap between where cost is created and where it’s monitored is where every surprise bill originates.
Here’s how the layers break down:
| Layer | What It Tracks | What It Misses |
|---|---|---|
| Infrastructure | CPU, GPU utilization, memory, latency | Token usage, routing decisions, model selection |
| Application | Errors, response time, request volume | Model decisions, prompt length, retry cost |
| Inference (decision layer) | Usually not instrumented | Everything that drives cost |
The inference layer is where routing decisions get made, where token budgets get consumed, where cache hits and misses determine whether you’re paying for compute or serving from memory. It’s also the layer that most monitoring stacks treat as a black box. The result: you have excellent visibility into system health and zero visibility into cost drivers.
The 5 Signals That Predict Cost Before It Spikes
Standard metrics tell you what happened. These signals tell you what’s about to happen. Each one is a leading indicator — a cost driver that moves before the bill does. Instrument these five and you move from reactive cost management to predictive cost control.
What to Instrument — The Inference Observability Stack
The architecture principle that governs inference observability is simple: instrumentation must exist at the same layer where decisions are made. Most teams instrument the infrastructure layer and the application layer. Neither one is where inference cost decisions happen. The decision layer — routing logic, model selection, token budget enforcement — is where the instrumentation has to live.
Build the observability stack across three layers:
The Budget Signal Pattern
Dollar alerts are lagging indicators. Token rate alerts are leading indicators. The distinction matters more than it sounds.
Most teams set cost alerts at the dollar level — notify when monthly spend exceeds $X. By the time that alert fires, the tokens are already spent, the requests already executed, the routing decisions already made. You can’t stop a cost spike that already executed. A dollar alert tells you what happened. It has no power over what’s happening.
Token rate — tokens consumed per minute per endpoint — fires earlier. A token rate anomaly is detectable within minutes of a routing change, a prompt length drift, or a cache configuration failure. By the time the same event would have triggered a dollar alert, a token rate alert would have fired twenty minutes earlier with enough runway to intervene.
Where Inference Observability Fails
Most teams can tell you what they spent. Very few can tell you why. The gap between those two statements is where inference observability fails in practice.
How the Series Connects
The AI Inference Cost series has been building a single architecture across four posts. Part 1 established the cost model — why inference behaves like egress and why the bill is structurally unpredictable without intervention. Part 2 covered execution budgets — the runtime controls that cap spend before it cliffs. Part 3 covered cost-aware model routing — getting requests to the right model at the right cost point.
Observability is the feedback loop that makes the other three work in production. Without it, budgets are blind — you don’t know if they’re working. Routing is unvalidated — you don’t know if requests are hitting the right model. Cost model predictions are theoretical — you have no real signal to calibrate against. Without observability, the other three are blind.
The full AI infrastructure architecture context — GPU fabric design, training vs inference split, and the hardware decisions that govern inference at scale — is covered in the AI Infrastructure Architecture guide and the Distributed AI Fabrics strategy guide. The Training/Inference Hardware Split post covers the infrastructure layer decisions that inference observability sits on top of.
Architect’s Verdict
You can’t enforce a budget you can’t see. And you can’t see inference cost until you instrument the decision layer.
The pattern that produces surprise bills is consistent: teams instrument the infrastructure layer, observe system health, and miss the cost signals that live one layer up. Token consumption, routing distribution, cache hit rate, retry behavior — these are the variables that determine what you pay. They’re also the variables that most monitoring stacks never capture.
Instrument the decision layer. Set token rate alerts, not just dollar alerts. Track routing distribution as a cost signal, not just a reliability signal. Treat cache hit rate as an efficiency metric with direct cost implications. The goal isn’t more dashboards — it’s visibility at the layer where cost decisions are actually made. That’s the only layer where intervention is still possible.
Additional Resources
Editorial Integrity & Security Protocol
This technical deep-dive adheres to the Rack2Cloud Deterministic Integrity Standard. All benchmarks and security audits are derived from zero-trust validation protocols within our isolated lab environments. No vendor influence.
R.M.
Senior Solutions Architect with 25+ years of experience in HCI, cloud strategy, and data resilience. As the lead behind Rack2Cloud, I focus on lab-verified guidance for complex enterprise transitions. View Credentials →
Get the Playbooks Vendors Won’t Publish
Field-tested blueprints for migration, HCI, sovereign infrastructure, and AI architecture. Real failure-mode analysis. No marketing filler. Delivered weekly.
Select your infrastructure paths. Receive field-tested blueprints direct to your inbox.
- > Virtualization & Migration Physics
- > Cloud Strategy & Egress Math
- > Data Protection & RTO Reality
- > AI Infrastructure & GPU Fabric
Zero spam. Includes The Dispatch weekly drop.
Need Architectural Guidance?
Unbiased infrastructure audit for your migration, cloud strategy, or HCI transition.
>_ Request Triage Session