VMWARE LICENSING COST MODEL
PROJECT YOUR VVF OR VCF RENEWAL ACROSS THREE YEARS. LOW, MID, AND HIGH RANGE — WITH ESCALATION, COST DELTA, AND ARCHITECTURE SIGNALS BUILT IN.
🔒 Privacy Architecture: No cookies. No tracking pixels. No server-side database.
This logic runs entirely in your local browser session.
The VMware Licensing Cost Model is Step 2 in a two-tool sequence. Where the VMware Core Calculator audits your licensed core footprint, this tool takes that number and projects what it costs — across three years, across three contract scenarios, and with the architectural signals that tell you whether your cost structure reflects a well-designed environment or one that’s been priced against its own inefficiencies.
Year-one VMware licensing cost is not the number that matters for infrastructure planning. The subscription renews, and it renews at Broadcom’s pricing at the time of renewal — a pricing dynamic that has trended in one direction since the acquisition closed. The enterprises currently in litigation over VMware costs were not surprised by year-one invoices. They were surprised by year two and year three. This tool builds the model that makes those numbers visible before the renewal conversation starts, not after it ends.
Most VMware cost estimates stop at a single number derived from a single assumption. The VMware Licensing Cost Model runs three scenarios simultaneously — Low, Typical, and Aggressive contract variability — against the same input footprint, and surfaces the spread between them. That spread is the negotiation range. Understanding where your environment sits within it is the difference between a renewal you modeled and one that surprised you.
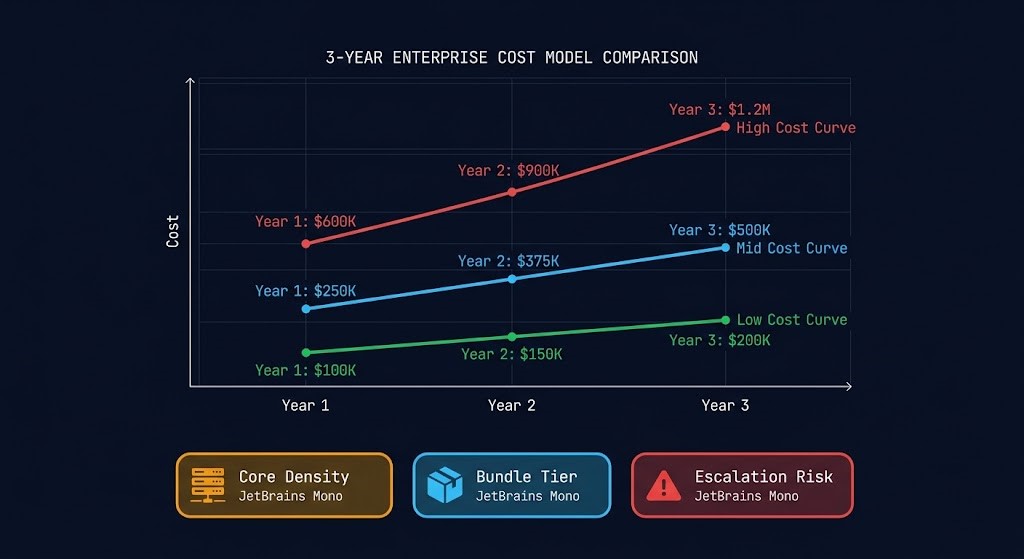
The cost outputs in this tool are not the primary deliverable. The architecture signals are. A high cost-per-VM ratio signals a low-density environment where licensing overhead dominates workload value. A VCF bundle driving cost signals potential feature over-provisioning. Escalation risk dominating the three-year curve signals a renewal structure that compounds against you. These signals are what architects need to make defensible infrastructure decisions — not just a number to hand to finance.
If you haven’t run the VMware Core Calculator yet, start there. The primary input to this tool — your total licensed core count — comes directly from that audit. Running the cost model against an unverified core count produces an unverified cost projection.
VMware Licensing Cost Model: Key Features
- Three-Scenario Projection: Low, Typical, and Aggressive contract variability scenarios run simultaneously against your footprint — surfacing the spread between best-case and worst-case renewal as a negotiation range, not a single point estimate.
- Architecture Signals: The tool identifies your primary cost driver (core density, bundle tier, DR overhead, or escalation compounding) and surfaces architecture-level signals — high cost-per-VM, VCF over-provisioning risk, escalation dominance — that translate cost data into infrastructure decisions. Methodology informed by FinOps Foundation cost modeling principles.
- VVF vs VCF Scenario Comparison: Side-by-side comparison mode runs both bundle tiers against your inputs simultaneously, showing the cost delta and crossover point — the specific core count or DR footprint size at which VCF becomes financially defensible relative to VVF.
- Cost Per VM and Cost Per Cluster: Derived metrics that translate the licensed core cost into workload-level economics — the numbers that make renewal cost tangible for application owners and leadership, not just infrastructure teams.
- Observed Pricing Ranges: All projections use observed post-Broadcom enterprise pricing ranges (2026 market data) — VVF $80–$120/core/year, VCF $140–$180/core/year — clearly labeled as market observations, not Broadcom list pricing. Broadcom does not publish list prices; verify current pricing directly before any renewal commitment.
BROADCOM RENEWAL AUDIT
The cost model surfaces the number. The triage session maps it against your renewal window, workload profile, and exit options — and tells you whether to negotiate, restructure, or move. One conversation. Deterministic output.
REQUEST CONFIGURATION REVIEWFrequently Asked Questions
Q: What pricing data does the VMware Licensing Cost Model use?
A: All projections use observed post-Broadcom enterprise pricing ranges from 2026 market data — VVF at $80–$120 per core per year, VCF at $140–$180 per core per year. These are market observations based on reported enterprise contract ranges, not Broadcom published list prices (Broadcom does not publish list pricing for enterprise subscriptions). Actual costs vary significantly based on contract structure, volume, term length, and negotiation. Always verify current pricing with Broadcom or your reseller before finalising a renewal budget.
Q: What is the difference between the VMware Core Calculator and the VMware Licensing Cost Model?
A: The VMware Core Calculator (Step 1) audits your licensed core footprint — applying the 16-core billing floor, calculating vSAN entitlement, and surfacing ghost core exposure. The VMware Licensing Cost Model (Step 2) takes that footprint and projects what it costs across three years, three contract scenarios, and two bundle tiers. Run Step 1 first to get a verified core count, then bring that number into Step 2 for the cost projection.
Q: What does “Contract Variability Factor” mean?
A: Broadcom does not publish standard list pricing for enterprise VMware subscriptions. Actual contract pricing varies based on volume, term length, negotiation leverage, and whether transition accommodations apply. The Contract Variability Factor represents three positions within the observed market range: Low reflects favorable contract outcomes (closer to the lower bound of observed pricing), Typical reflects midpoint market rates, and Aggressive reflects unfavorable renewal conditions — minimal discount, full bundle pricing, no accommodation. Running all three gives you the spread your renewal budget should be planning against.
Q: How is the Architecture Signal generated?
A: The Architecture Signal is derived from the relationship between your inputs and outputs — not from external benchmarks. A high cost-per-VM ratio relative to your cluster density signals a low-density environment where licensing overhead is disproportionate to workload value. VCF driving cost in an environment with low vSAN utilization signals feature over-provisioning. Escalation risk dominating the three-year curve signals a renewal structure that compounds faster than infrastructure growth justifies. These are architectural observations, not recommendations — the signal tells you what the cost structure reflects. What to do about it is the architecture decision.