CPU Ready vs. CPU Wait: Why Your Cluster Looks Fine but Feels Slow

The Reality Check: “Everything is Slow, But the Dashboard Says 30%”
You know the ticket. “The application is sluggish.” You pull up Prism Element or vCenter. You look at the cluster average CPU usage. It’s sitting at a comfortable 35%. You check the specific VM. It’s idling at 20%.
You close the ticket: “Infrastructure looks fine. Check your code.”
Two hours later, the CIO is at your desk because the CFO’s report took 40 minutes to generate instead of 4. You didn’t look deep enough. You looked at consumption, not contention. In a virtualized world, “usage” is irrelevant if the processor can’t get time on the physical core.
This is the silent killer of virtualization: CPU Ready (or Steal, or Co-Stop). It’s why your “powerful” 32-vCPU SQL server is running slower than a laptop. (Note: If you need a refresher on how the hypervisor abstracts these resources at a systemic level, bookmark the Modern Virtualization Learning Path).
The Mechanics: The vSMP Scheduler & The “Tetris” Problem
The hypervisor — whether ESXi or AHV — is a traffic cop. It doesn’t “give” CPU to a VM; it schedules time slots on physical cores.
The “Right-Sizing” Paradox
Junior admins think “More vCPUs = More Speed.” This is false. It is the opposite of physics.
If you assign 24 vCPUs to a VM on a host with 28 physical cores, the scheduler has to find 24 physical cores that are free at the exact same nanosecond to execute a cycle. This is Co-Stop (%CSTP in ESXi). While the scheduler waits for those 24 lanes to clear, your VM sits frozen. It is “Ready” to process, but it is waiting.
The Metric That Matters:
- CPU Ready (%RDY): The time the VM wanted to run but the hypervisor said “Wait your turn.”
- Threshold: If this is >5% per vCPU, your users are suffering. If it’s >10%, your application is broken.
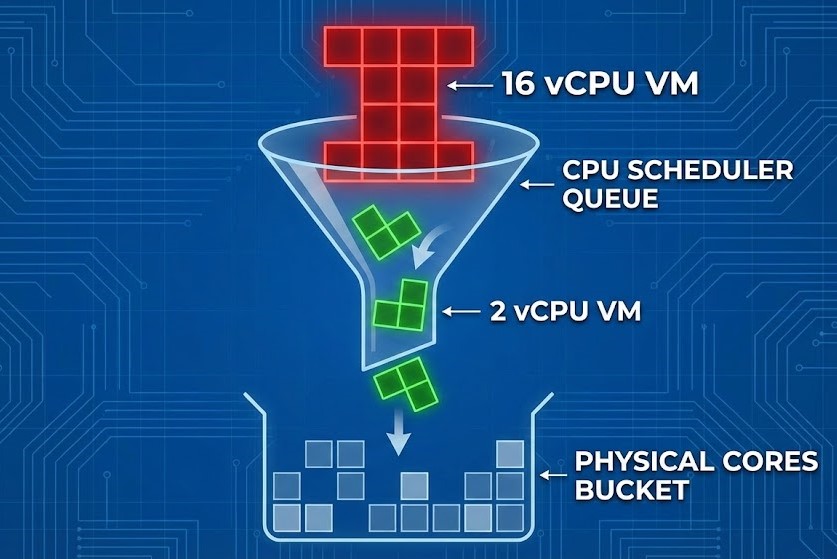
Caption: The “Tetris” Problem: Large VMs wait longer for a free slot than small VMs.
The Noisy Neighbor & The Pool
This gets worse in shared pools. If you have a developer spinning up 50 microservices on the same host as your production database, and they are all fighting for the same L3 cache and physical cycles, your pooling physics break down. The hypervisor spends more time context-switching — loading and unloading CPU registers — than actually computing.
This is the same shared silicon problem covered in depth in Part 1 of the Post-Broadcom Migration Series — where the CVM and user VMs compete for the exact same L3 cache on every HCI node.
The Solution: The HCI Handshake (Don’t Starve the CVM)
Hyper-Converged Infrastructure adds a layer of complexity that legacy 3-tier architects miss. In Nutanix AHV or vSAN, the storage controller is a VM (CVM). It needs CPU to process I/O.
If your host is saturated with high %RDY, the CVM also waits for CPU time. The result: High CPU Ready causes High Storage Latency. The application team sees “Disk Latency” and blames storage. You buy more SSDs. The problem persists because the SSDs are fast — the CVM just couldn’t get the CPU cycles to acknowledge the write.
For a full breakdown of CVM resource requirements and how to correctly calculate CPU headroom in HCI environments, see the HCI Architecture Learning Path.
Diagnosing CPU Ready and Steal Time in ESXi and AHV
Don’t trust the GUI averages. You need raw kernel metrics.
For ESXi (The Gold Standard)
Bash
# SSH into the host. Do not run during backups.
esxtop

# Press 'c' for CPU view.
# Shift + 'V' to only show running VMs.
# Look at the %RDY column.
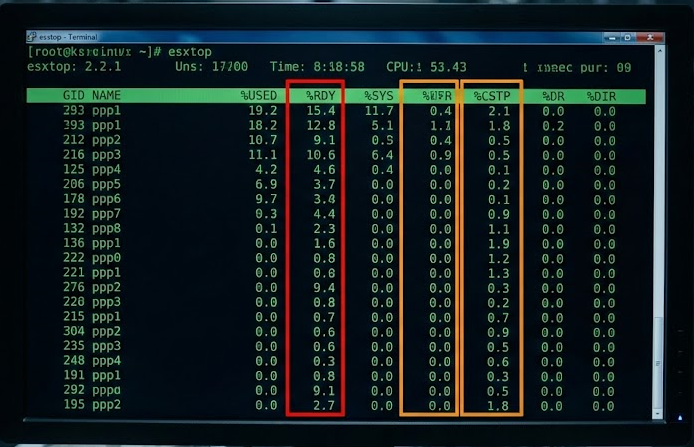
Caption: The Smoking Gun: Any number over 5.0 in the %RDY column means your VM is gasping for air.
- Formula:
%RDY / 100 * (Update Interval). If the number is huge, look at%CSTP. High CSTP means you gave the VM too many vCPUs. Downsize it.
For AHV (The Linux Approach)
AHV is KVM-based. We look at scheduler wait time — specifically Steal Time (%st), which measures how often the hypervisor is taking CPU cycles away from your VM to serve other workloads or itself.
Bash
# SSH into the CVM
hostssh "top -c | grep qemu"

# Or use the specific AHV monitoring tool
# Check for 'steal' time in the guest OS
# On the Guest VM (Linux):
top
# Look at the "%st" (steal) value in the CPU row.
If %st is non-zero, the hypervisor is stealing cycles from your VM to serve someone else (or itself).
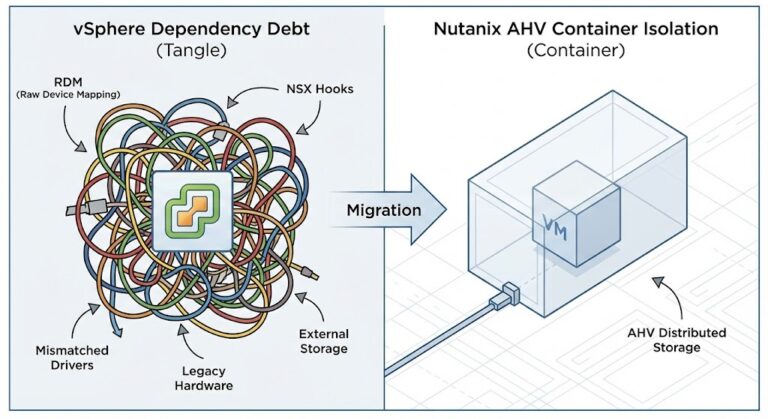
The Migration Trap: vSphere -> AHV
When executing a vSphere to AHV migration, do not lift and shift. VMware’s scheduler is slightly more forgiving of oversized VMs than KVM due to different co-scheduling algorithms — relaxed vs. strict. A 12-vCPU VM that “ran fine” on ESXi might choke on AHV if you don’t right-size it during the move.
Use the migration as an audit opportunity. If a VM averages 15% utilization but has 8 vCPUs, cut it to 4. You will actually increase performance.
For a complete breakdown of what changes at the kernel level during a vSphere to AHV migration — including scheduler semantics, NUMA locality, and CVM arbitration — see the vSphere to AHV Migration Strategy and Part 1: Beyond the VMDK.
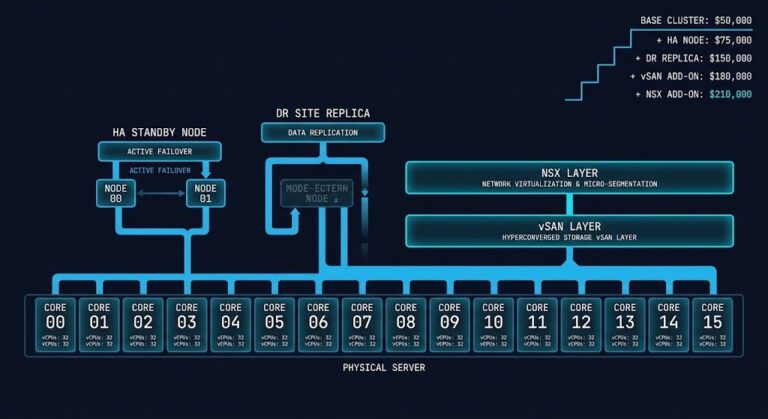
Architect’s Verdict: Three Heuristics for CPU Management
We treat CPU like an infinite bucket. It isn’t. It is a time-share condo. If everyone tries to use the pool at 2 PM, nobody swims.
My 3 Heuristics for CPU Management:
- The 2-vCPU Rule: Start every new VM with 2 vCPUs. Prove you need more. Require screenshots of CPU Ready <1% and utilization >80% before granting additional cores.
- The NUMA Law: Never size a VM larger than a single NUMA node. If your server has 14 cores per socket, your maximum VM size is 14 vCPUs. Cross the NUMA boundary and you introduce memory latency that erases the CPU gains. This is covered in depth in the Compute Architecture Learning Path.
- The Ready Alarm: Set your monitoring— Prism or vCenter — to alert on
%RDY > 500ms(summation) or5%. Ignore “Usage.” Usage is vanity; Ready is sanity.
Stop throwing hardware at “slow.” Start taking vCPUs away. Your cluster will thank you.
To see how CPU run queues interact with memory ballooning and storage latency as a coupled system, see The Resource Pooling Physics.
Additional Resources
For deeper technical context on the concepts covered in this guide:
Editorial Integrity & Security Protocol
This technical deep-dive adheres to the Rack2Cloud Deterministic Integrity Standard. All benchmarks and security audits are derived from zero-trust validation protocols within our isolated lab environments. No vendor influence.
R.M.
Senior Solutions Architect with 25+ years of experience in HCI, cloud strategy, and data resilience. As the lead behind Rack2Cloud, I focus on lab-verified guidance for complex enterprise transitions. View Credentials →
Get the Playbooks Vendors Won’t Publish
Field-tested blueprints for migration, HCI, sovereign infrastructure, and AI architecture. Real failure-mode analysis. No marketing filler. Delivered weekly.
Select your infrastructure paths. Receive field-tested blueprints direct to your inbox.
- > Virtualization & Migration Physics
- > Cloud Strategy & Egress Math
- > Data Protection & RTO Reality
- > AI Infrastructure & GPU Fabric
Zero spam. Includes The Dispatch weekly drop.
Need Architectural Guidance?
Unbiased infrastructure audit for your migration, cloud strategy, or HCI transition.
>_ Request Triage Session