The CVM Tax: How Mis-Sized Controller VMs Quietly Kill AHV Performance
The “Ghost Latency” Ticket
You know this ticket. It always looks the same.
User: “The SQL database is crawling. The app is unusable.”
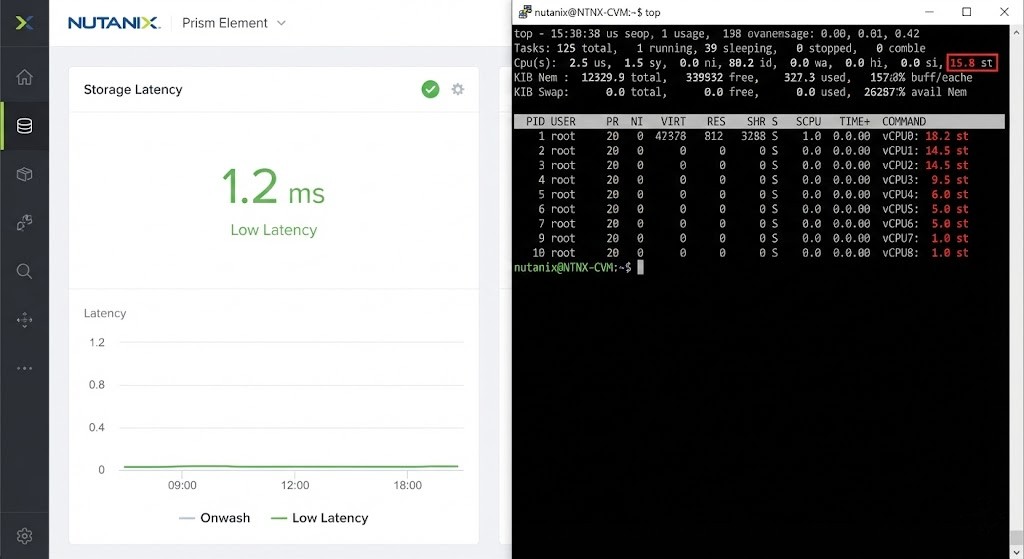
Admin: “I checked Prism. Storage latency is 1.2ms. Network is clear. It’s your code.”
Here’s the truth: you’re both right — and both wrong.
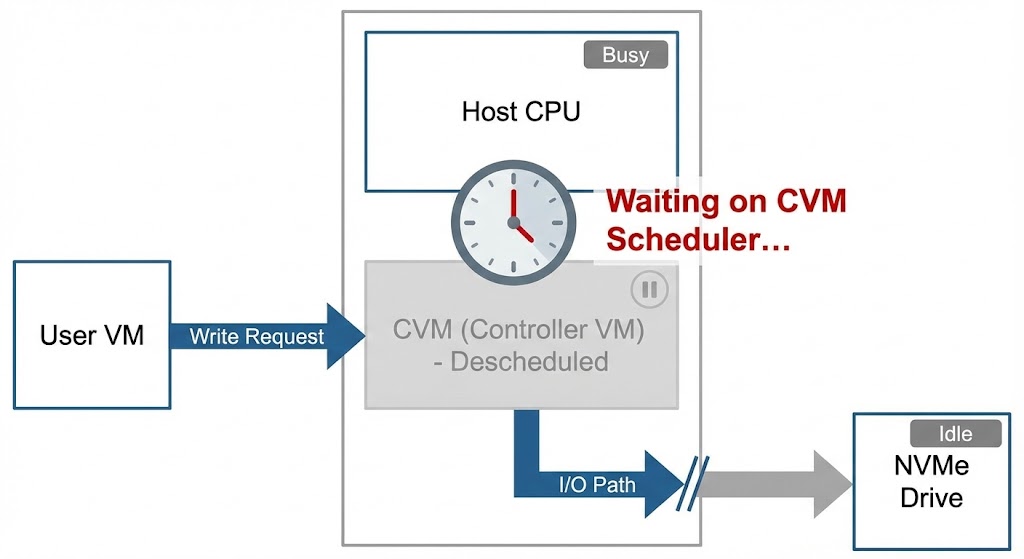
The dashboard claims the disk is fast, but that’s because it only starts the stopwatch once the storage controller begins handling the I/O. It ignores everything that happens before that. If the Controller VM (CVM) is stuck waiting for CPU time in the hypervisor, that delay doesn’t show up. It’s invisible, but it’s real.
This is what I call the CVM Tax.
In a traditional SAN, the controller is a big box with its own chips, totally dedicated. In HCI, the controller is just another VM, sharing the same CPU socket as your workloads. If you don’t give the CVM enough resources — or just leave it at the default settings — you create a hidden bottleneck. The disks might be lightning-fast NVMe, but the controller is running like it’s 2015.
Your cluster doesn’t crash. It just slowly gets sluggish. Everything feels a little “off.”
Why the CVM Isn’t Just Overhead
It’s time to rethink how we see this VM. In Nutanix AHV, the CVM isn’t there for management — it is the storage control plane.
- Metadata: Where’s the data? (Cassandra)
- I/O Path: Reading and writing data. (Stargate)
- Data Services: Compression, deduplication, erasure coding
- Resiliency: Rebuilding after failures. (Curator)
Every read and write — even local NVMe traffic — goes through the CVM.
If you under-size it, it’s like buying a Ferrari and swapping in a lawnmower engine. The CVM tax is also one of the primary operational constraints that determines whether Nutanix is the right platform choice for your environment — covered in full context in Proxmox vs Nutanix vs VMware: The Post-Broadcom Constraints No One Explains.
For a deep technical walkthrough of this architecture, see the Nutanix Bible (the authoritative source on CVM internals and I/O flow).
How to Prove the CVM Tax in Your Environment
Stop guessing. If you think the control plane is starved, prove it at the scheduler level.
1. Check CVM CPU Ready / Steal Time
If the CVM wants to run but can’t get CPU, you’ll see “Steal Time” (%st) spike inside the CVM’s Linux OS.
SSH into a CVM and run:
top
Look at the %st value on the CPU line:
- < 1% → Healthy
- 2–5% → Contention, but survivable
- > 5% → The controller is being descheduled. Latency is guaranteed.
This aligns with Linux scheduler behavior documented here.
2. Verify NUMA Locality
On dual-socket servers, the CVM must run on the same socket as the NVMe drives or HBA, with memory local to that socket. If it crosses sockets (QPI/UPI), latency doubles.
On the AHV host, run:
numastat -p <CVM_PID>
If you see high numa_miss or remote memory access, your CVM is spanning sockets — and paying a latency tax.
NUMA behavior and memory locality effects are well-documented here.
Remediation: How Much CVM Is Enough?
The default sizing (8 vCPU / 32 GB RAM) is a trap. It was designed for SATA SSDs and minimal data services. In a modern NVMe + encryption + dedupe world, it’s insufficient.
Architect’s Decision Matrix
| Workload Profile | Disk Type | Data Services Enabled | CVM vCPU | CVM RAM |
|---|---|---|---|---|
| VDI / Light IO | SATA SSD | None | 4–6 | 32 GB |
| General OLTP | NVMe | Snapshots | 8–12 | 64 GB |
| Analytics / AI | NVMe | Dedupe + Encryption | 12–16+ | 96–128 GB |
Adding memory increases:
- Metadata Cache (Cassandra),
- Read Cache (Stargate),
- Which directly reduces backend I/O and queue depth.
Official Nutanix sizing guidance for advanced features.
How to Resize (Gracefully)
Do not power off all CVMs at once. Use a rolling approach.
Step 1: Check cluster health
ncli cluster get-health-summary
Step 2: Shutdown one CVM at a time
acli vm.shutdown <CVM_Name>
Step 3: Resize (via Prism or CLI), power it back on, wait for data resiliency to return to green, then proceed to the next node.
This aligns with Nutanix rolling maintenance best practices.
Validation: Did You Fix the CVM Tax?
You resized the CVMs — now validate.
- Re-check Steal Time: Run
topagain.%stshould be near zero. - Log Stability: SQL/app logs should stop showing random latency spikes under load.
- Linearity Test: In Prism, increase workload. IOPS should rise without latency exploding. If IOPS and latency scale together (not diverging), the controller plane is no longer the bottleneck.
This follows standard storage performance validation methodology
The Architect’s Verdict
Stop thinking of the CVM as overhead — it’s the engine.
Never let your control plane fight your data plane for survival. Over-provision the CVM. Respect NUMA boundaries. And don’t trust pretty dashboards — watch Steal Time.
This is why HCI is about control-plane orchestration, not just storage abstraction (see our breakdown of the HCI vs. 3-tier storage handshake).
If you’re building your Virtualization Architecture Pillar, get CVM sizing right from day one. If you’re tuning an existing cluster, dive into our Modern Virtualization Learning Path for more performance tuning scripts.
CVM Performance FAQ
Q: What is CVM “Steal Time” and why does it matter?
A: Steal Time (%st) is the percentage of time the CVM wanted to run but the physical CPU was busy serving other VMs. High steal time means your storage controller is paused — causing latency.
Q: Does enabling Deduplication increase CVM CPU usage?
A: Yes. Dedupe requires fingerprinting writes (SHA hashing), which is CPU-intensive. If you enable dedupe, you must increase CVM vCPUs accordingly.
Q: Can a starved CVM cause VM stuns?
A: Yes. If the CVM cannot acknowledge writes fast enough, the hypervisor may pause guest VMs to prevent data integrity issues.
Q: How does NUMA affect Nutanix performance?
A: If the CVM accesses memory on a remote socket, latency increases due to QPI/UPI traversal. Pinning the CVM to the local socket minimizes memory access latency for NVMe operations.
Deep Research & References
Editorial Integrity & Security Protocol
This technical deep-dive adheres to the Rack2Cloud Deterministic Integrity Standard. All benchmarks and security audits are derived from zero-trust validation protocols within our isolated lab environments. No vendor influence.
R.M.
Senior Solutions Architect with 25+ years of experience in HCI, cloud strategy, and data resilience. As the lead behind Rack2Cloud, I focus on lab-verified guidance for complex enterprise transitions. View Credentials →
Get the Playbooks Vendors Won’t Publish
Field-tested blueprints for migration, HCI, sovereign infrastructure, and AI architecture. Real failure-mode analysis. No marketing filler. Delivered weekly.
Select your infrastructure paths. Receive field-tested blueprints direct to your inbox.
- > Virtualization & Migration Physics
- > Cloud Strategy & Egress Math
- > Data Protection & RTO Reality
- > AI Infrastructure & GPU Fabric
Zero spam. Includes The Dispatch weekly drop.
Need Architectural Guidance?
Unbiased infrastructure audit for your migration, cloud strategy, or HCI transition.
>_ Request Triage Session