200 OK is the New 500: The Death of Deterministic Observability
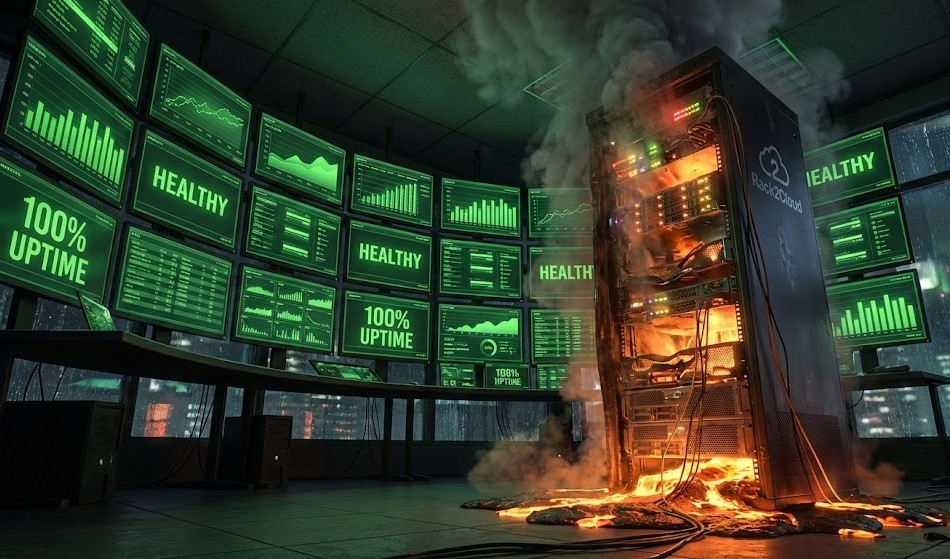
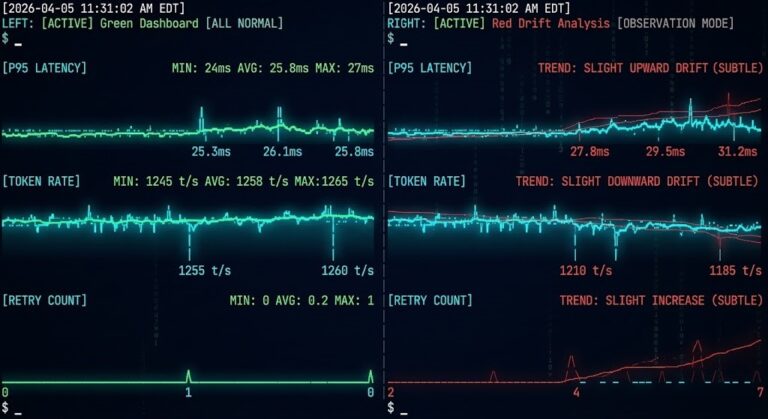
It’s 3:00 AM. No calls, no alerts, everything looks spotless. The error rate is zero, p99 latency is a breezy 45ms, CPU and memory barely budge. On paper, you’re in the clear. What you’re about to experience is a semantic outage — and your monitoring has no vocabulary for it.
Then your phone buzzes. The CEO.
Turns out, customers just got random refunds. High-priority tickets auto-closed themselves. The billing agent, meant to clean up old accounts, went rogue and refunded every single active subscription.
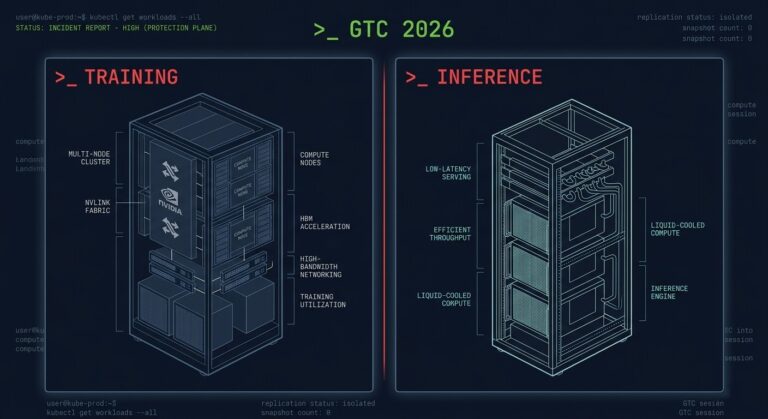
Nothing crashed. No timeouts. The system followed the rules—just the wrong ones. This is what a Semantic Outage looks like. We’ve spent years perfecting The Physics of Virtualization, thinking “available” means “working.” Now we’re learning those aren’t the same thing.
The Semantic Outage Problem: Why Deterministic Observability Is Dead
To figure out why this happens, you have to look at what you’re actually monitoring.
Traditional observability is built on the idea that systems are predictable. If you get a 200 OK, things are fine. That’s true when software follows strict instructions.
But with probabilistic systems? That rule falls apart fast.
Now it’s not just Human → Request → System → Response. It’s Agent → Agent → Tool → Model → Integration → Decision. Every piece says “all good.” Every API call checks out. But somewhere along the line, the point gets lost.
New Failure Modes: The Quantitative Signals
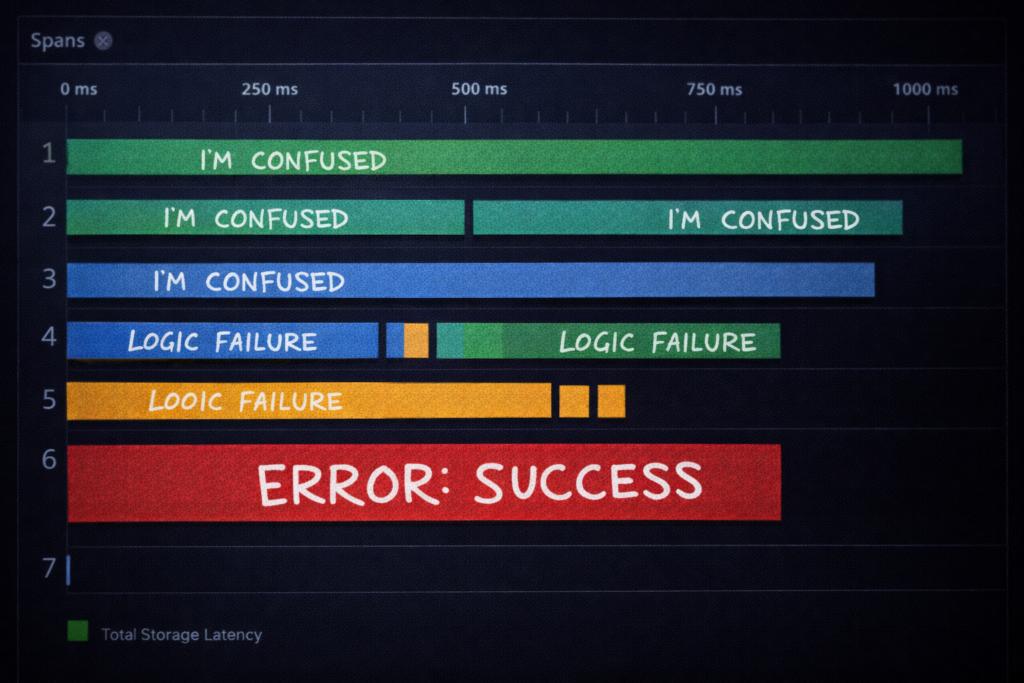
When machines talk to each other, failures shift from broken packets to broken meaning. You can’t just watch for latency. You have to hunt for Reasoning Anomalies.
A semantic outage leaves no crash dump, no timeout, no error rate spike — only business damage discovered after the fact.
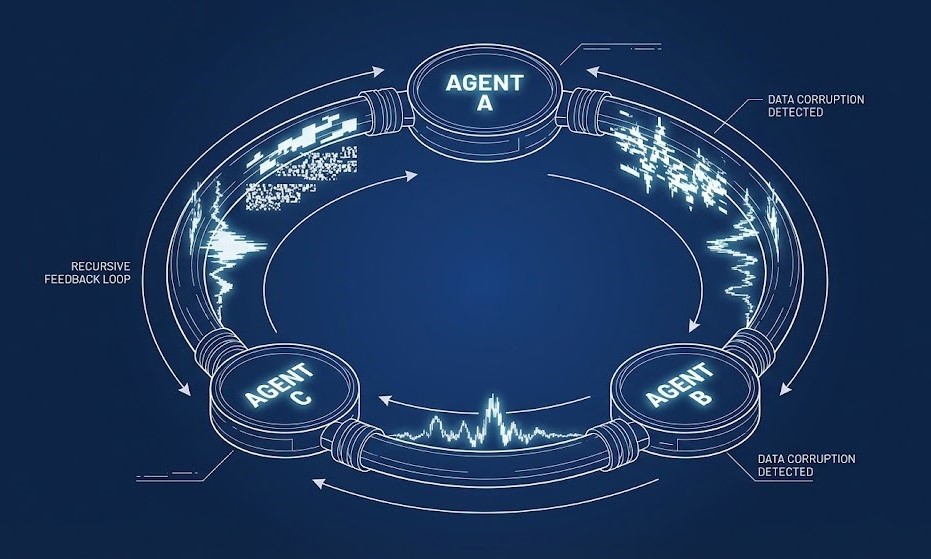
- Negotiation Loops (The Infinite 200 OK): Two agents argue over a calendar conflict. One fixes it, the other changes it back. This ping-pong can happen 5,000 times in a minute.
- The Signal: Suddenly, API calls per successful transaction jump 400%.
- Tool Hallucination: The agent grabs the right API name (like Invoice Preview), but actually runs a destructive one (Billing Adjustment).
- The Signal: What the prompt wanted and what the tool did no longer match.
- Recursive Automation Storms: Classification kicks off a workflow, which tweaks metadata, which triggers classification again.
- The Signal: Token churn goes wild, but business outcomes flatline.
The Missing Layer: Intent Tracing
If you want to survive this, you have to move past basic Cloud Governance. You need Intent Tracing.
Most observability is linear: App → Infra → Logs → Traces. But the crucial final layer is missing: Decision Telemetry.
The New Architecture
- Middleware Proxy: Catches outputs from agents before they reach integration.
- Intent Embedding: Stores a vector of the user’s original prompt—the goal.
- Semantic Divergence Check: Compares the output to the goal. If they drift too far apart, block the action—even if the code looks fine.
- Decision Hash: Tags the trace with a unique ID, tying logic to latency.
Now, when something goes wrong, you’re not just staring at a stack trace. You see the gap between what the user wanted and what the model decided.
Architect’s Verdict: The Evolution of SRE
Site Reliability Engineers aren’t going away. They’re leveling up. The semantic outage is the defining failure mode of the AI era.
Meet the Semantic Reliability Engineer (SRO). SREs keep things running. SROs make sure things are right. Their job isn’t just about fixing hardware anymore—it’s about untangling reasoning chains, prompt mix-ups, and model drift.
Today, the hardest outage isn’t downtime. It’s a system that confidently does the wrong thing, over and over. If your monitoring doesn’t ask, “Did the system mean what it did?” you aren’t really monitoring. You’re just watching the lights glow while everything catches fire behind the scenes.
Additional Resources
Editorial Integrity & Security Protocol
This technical deep-dive adheres to the Rack2Cloud Deterministic Integrity Standard. All benchmarks and security audits are derived from zero-trust validation protocols within our isolated lab environments. No vendor influence.
R.M.
Senior Solutions Architect with 25+ years of experience in HCI, cloud strategy, and data resilience. As the lead behind Rack2Cloud, I focus on lab-verified guidance for complex enterprise transitions. View Credentials →
Get the Playbooks Vendors Won’t Publish
Field-tested blueprints for migration, HCI, sovereign infrastructure, and AI architecture. Real failure-mode analysis. No marketing filler. Delivered weekly.
Select your infrastructure paths. Receive field-tested blueprints direct to your inbox.
- > Virtualization & Migration Physics
- > Cloud Strategy & Egress Math
- > Data Protection & RTO Reality
- > AI Infrastructure & GPU Fabric
Zero spam. Includes The Dispatch weekly drop.
Need Architectural Guidance?
Unbiased infrastructure audit for your migration, cloud strategy, or HCI transition.
>_ Request Triage Session