Your Backup Costs Aren’t What You Think: Calculating the True Cost Beyond Storage
You didn’t underestimate backup storage. You underestimated your true backup costs.
Storage costs are what vendors quote. GB/month is a number that fits in a spreadsheet, survives a budget review, and closes a procurement conversation. It is also the smallest component of what backup actually costs in production — and in most architectures, not the one that breaks the model.
The cost that breaks the model arrives later: when data moves across a billing boundary on replication, when a DR test exercises cold storage retrieval for the first time, when a recovery event fires all the egress multipliers at once under RTO pressure. None of those events appear on the vendor quote. All of them appear on the invoice.
This guide covers the cost components that don’t appear in the vendor pricing deck, the multipliers that make backup cost nonlinear at scale, and a framework for modeling true backup cost before the DR event — not after it.
The Illusion — Backup Cost Equals Storage
The reason teams underestimate backup cost is structural, not accidental. Vendor pricing models lead with storage. The licensing conversation starts with GB protected or TB stored. The cloud provider invoice shows a storage line item. The backup software dashboard surfaces capacity used.
None of those views show what it costs to move that data, compute against it, test recovery from it, or restore it under pressure. The storage number is real — it is just not the number that determines whether your backup architecture is financially sustainable at scale.
The Real Backup Costs Components
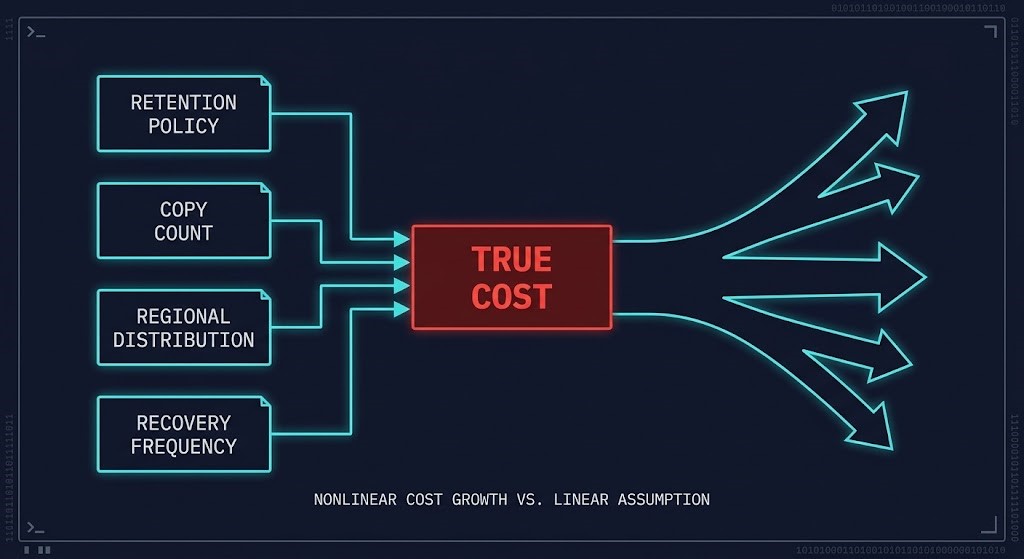
Backup cost has five components. Most architectures model one of them.
Storage is the baseline — predictable, well-understood, and almost always the cheapest component per GB at scale. Object storage tiers have commoditized this to fractions of a cent per GB per month for cold data. Current provider rates are published on the AWS Data Transfer pricing page — verify before budgeting at scale. It is the component vendors lead with because it is the most favorable number in the comparison
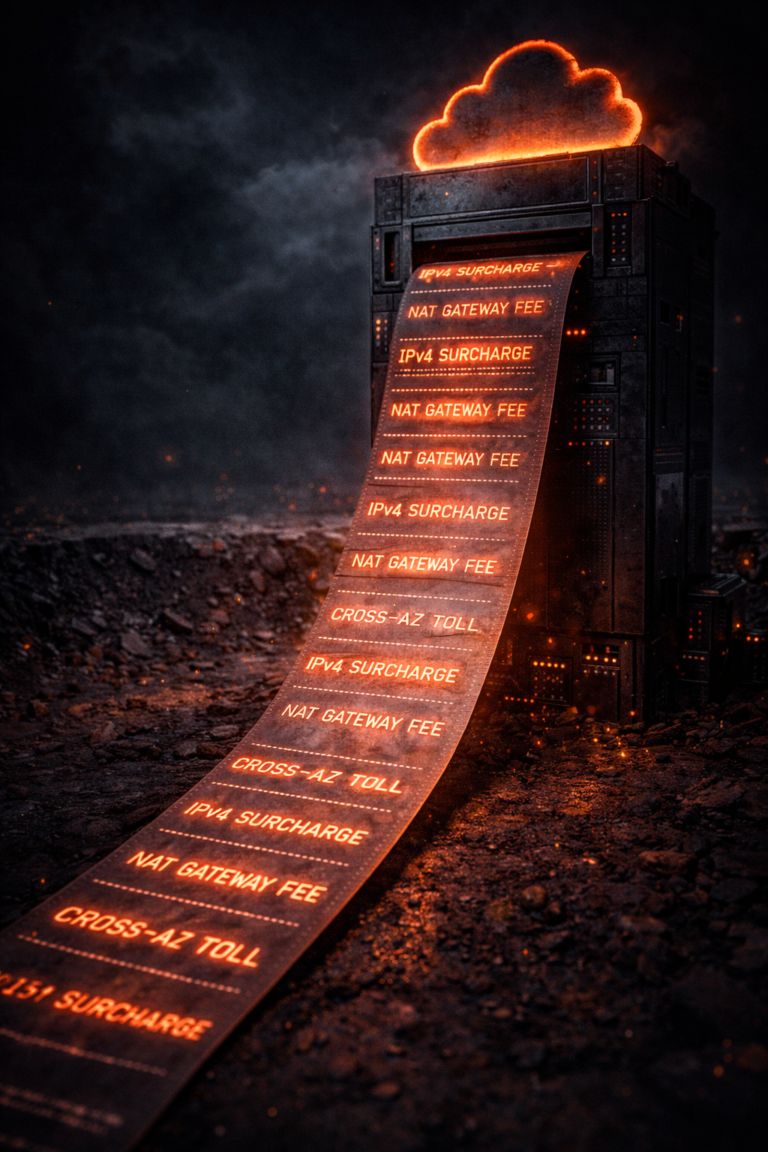
Data movement is where the first surprise arrives. Every backup job moves data — from source to target, from primary to secondary, from on-premises to cloud, across regions for geographic redundancy. Each movement event is a potential egress charge. Replication to a secondary region doubles the movement cost. Cross-cloud replication multiplies it again. The restore event — the one that actually matters — generates the largest single data movement event in the entire backup lifecycle, and it is almost never included in the cost model. Cloud egress on a full restore from archive storage can exceed the annual storage cost in a single event. The same egress physics documented in <a href=”https://www.rack2cloud.com/cloud-egress-costs-explained/” class=”r2c-link”>Cloud Egress Costs Explained</a> apply directly to backup data movement — replication, restore, and cross-region copies all cross billing boundaries and all generate metered transfer events.
Compute is the invisible tax on every backup operation. Compression, deduplication, encryption, and cataloging all consume CPU and memory on the backup server or proxy during the job window. Restore workloads — particularly full restores under RTO pressure — can saturate compute capacity at precisely the moment the business needs it most. Backup rehydration from compressed or deduplicated backup chains is one of the primary RTO bottlenecks that never appears in backup architecture reviews. The <a href=”https://www.rack2cloud.com/backup-rehydration-rto-bottleneck/” class=”r2c-link”>backup rehydration and RTO bottleneck</a> analysis covers how deduplication ratios and compression algorithms directly determine restore throughput under pressure.
Recovery cost is the component that breaks every model that ignores it. A DR test that exercises full recovery from a cold storage tier exposes retrieval fees, rehydration time, and bandwidth constraints that the backup job cost model never accounted for. A ransomware recovery event that requires restoring 50TB from archive storage generates egress fees, retrieval charges, and compute costs that can exceed the entire annual backup budget in 72 hours. The <a href=”https://www.rack2cloud.com/universal-cloud-restore-calculator/” class=”r2c-link”>Universal Cloud Restore Calculator</a> models the real financial impact of a recovery event by tier and provider — it is the calculation that should precede the storage tier selection, not follow it.
Operational overhead is the cost that never appears in a vendor quote and rarely surfaces in an internal cost model. Backup job monitoring, failure triage, policy management, compliance reporting, and the engineering time required to maintain backup infrastructure at production fidelity all represent real cost. In architectures using multiple backup tools across hybrid environments, the operational overhead frequently exceeds the storage cost.
The Multiplier Effect
Backup cost is not linear. The five components above interact with architectural decisions in ways that compound cost faster than storage growth alone.
The interaction between these multipliers is where backup cost models fail. An architecture that adds a geographic copy for ransomware resilience, extends retention for compliance, and adds a cloud tier for cost optimization has not made three independent decisions. It has made three decisions that multiply against each other on every backup cycle, every replication event, and every recovery drill.
Where Models Break
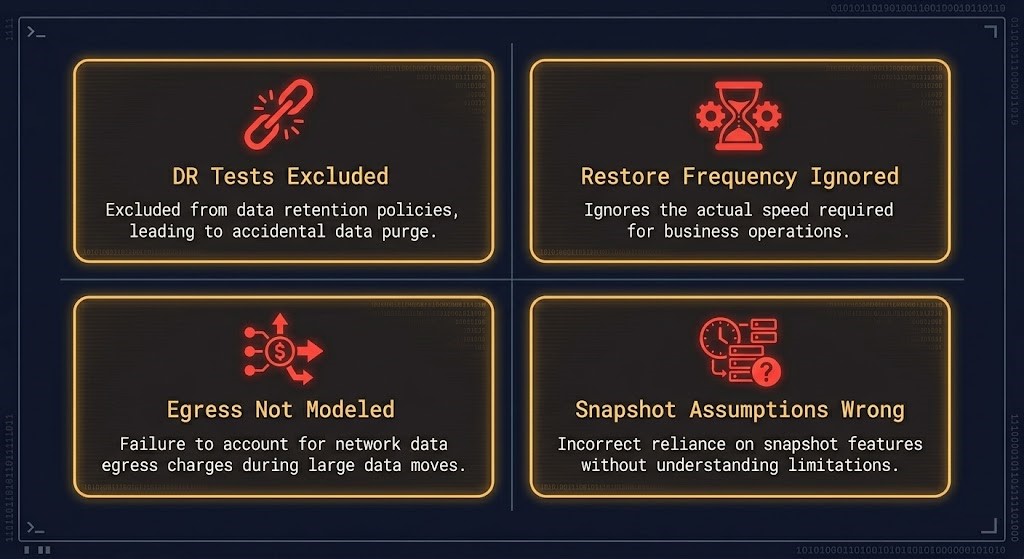
The backup cost models that fail in production share four common failure patterns.
What to Actually Model
A complete backup cost model has five inputs. The first one is what vendors provide. The other four require architectural analysis.
Storage // baseline GB × retention × copy count × tier cost
+ Data Movement // ingest + replication + restore events × egress rate
+ Compute // job execution + compression + restore workload
+ Recovery Events // DR tests + actual restores × retrieval + egress
+ Operational Overhead // management time + tooling + compliance reporting
The storage input is the one vendors provide. The remaining four require architectural analysis — which tiers data lands on, which regions it replicates to, how often recovery is exercised, and what the operational model looks like at scale.
For RTO and RPO modeling, the RPO/RTO/RTA disaster recovery architecture framework maps how recovery time objectives translate into infrastructure constraints — and how those constraints feed directly into the compute and data movement inputs of the cost model.Vendor-specific cost modeling across Rubrik, Cohesity, and Veeam produces materially different true costs for the same data protection policy — dedupe ratios, storage tiering behavior, and egress handling vary enough that platform selection is a cost architecture decision, not just a feature comparison.
Architect’s Verdict
Storage is the smallest part of your backup cost. Recovery is the part that breaks your model.
The teams that get surprised by backup cost are not the ones who chose the wrong vendor or the wrong storage tier. They are the ones who modeled the write path and never modeled the read path — who optimized for backup job cost and never stress-tested what recovery actually costs at production scale under time pressure.
The fix is not to spend more on backup. It is to model the full cost surface before the architecture is committed — including the DR test that exercises cold storage retrieval, the cross-region restore that fires all the egress multipliers at once, and the ransomware event that turns a theoretical cost model into a real invoice. Model the recovery. Not just the backup.
Backup cost is one constraint in a broader data protection decision framework. The Data Protection Architecture pillar covers immutability design, recovery metric engineering, and the gap between DR that is configured and DR that actually works under failure conditions.
Explore Data Protection →Additional Resources
Editorial Integrity & Security Protocol
This technical deep-dive adheres to the Rack2Cloud Deterministic Integrity Standard. All benchmarks and security audits are derived from zero-trust validation protocols within our isolated lab environments. No vendor influence.
R.M.
Senior Solutions Architect with 25+ years of experience in HCI, cloud strategy, and data resilience. As the lead behind Rack2Cloud, I focus on lab-verified guidance for complex enterprise transitions. View Credentials →
Get the Playbooks Vendors Won’t Publish
Field-tested blueprints for migration, HCI, sovereign infrastructure, and AI architecture. Real failure-mode analysis. No marketing filler. Delivered weekly.
Select your infrastructure paths. Receive field-tested blueprints direct to your inbox.
- > Virtualization & Migration Physics
- > Cloud Strategy & Egress Math
- > Data Protection & RTO Reality
- > AI Infrastructure & GPU Fabric
Zero spam. Includes The Dispatch weekly drop.
Need Architectural Guidance?
Unbiased infrastructure audit for your migration, cloud strategy, or HCI transition.
>_ Request Triage Session