

Cloud Egress Cost Analyzer
Calculate the financial impact of data movement before it becomes an architectural constraint.
Most cloud cost overruns are not compute problems. They are data movement problems — and most architects don’t discover that until the bill arrives. Egress cost is invisible during architecture design, absent from capacity planning, and missing from most FinOps dashboards until it becomes a line item too large to ignore. By then, the architecture that created it is already in production.
The Cloud Egress Cost Analyzer surfaces the real cost of data movement before deployment decisions are made. It models the tiered pricing waterfalls of AWS, Azure, and GCP — covering intra-region, inter-region, and cross-cloud transfer paths — and exposes not just the per-GB rate but the effective financial exposure of your architecture. More importantly, it applies the Egress Multiplier Engine: the mechanism that explains why actual egress costs are routinely three to ten times what architects estimated. The multiplier is not the rate. The multiplier is the pattern.
01 — Monthly Egress Cost
Tiered pricing waterfall calculation per provider — AWS, Azure, GCP. Detects transfer path automatically: intra-region (free), inter-region (backbone rates), or cross-cloud (internet egress rates). Applies effective volume after multipliers.
02 — Annualized Exposure
Monthly cost projected to an annual figure. Finance teams think annually. Architecture budgets are annual. The number that belongs in your architecture proposal is not the monthly run rate — it is the twelve-month exposure.
03 — Egress Dependency Tier
Six-tier classification from Baseline to Repatriation Candidate, based on monthly cost and transfer pattern. Each tier carries a distinct architectural implication — from data locality confirmation at the low end to a formal lock-in barrier assessment at the high end.
04 — Exit Difficulty Rating
Four-level rating scored on provider pattern, volume, and combined multiplier factor. Exit difficulty is an architecture signal, not a billing metric — it measures how much financial friction your current topology creates for future architectural change.
05 — Private Interconnect Break-Even
Fires on High/Critical exit difficulty or Lock-In/Repatriation tiers. Compares current annualized egress cost against estimated private circuit cost (Direct Connect, ExpressRoute, GCP Dedicated Interconnect) with savings delta. Override circuit cost to model your specific agreement.
Egress Dependency Tier Reference
Data locality is working. Transfer patterns are within region boundaries. Continue monitoring if workload volume is expected to scale.
Within acceptable operating range for the transfer pattern detected. No immediate architecture action required.
Cost trajectory warrants architecture review before volume growth embeds the pattern further into the operational budget.
Cost justification is required at this scale. Document the architectural drivers and evaluate data locality and query-in-place alternatives before the cost becomes a fixed operating assumption.
A financial barrier to architectural change is forming. Egress cost at this level makes workload relocation or provider change increasingly difficult to justify on a short time horizon. Evaluate private interconnect break-even immediately.
Sustained egress at this level changes the economics of the entire cloud relationship. Interconnect or repatriation economics apply. This is a formal cost architecture problem — not a billing anomaly.
The Egress Multiplier Engine
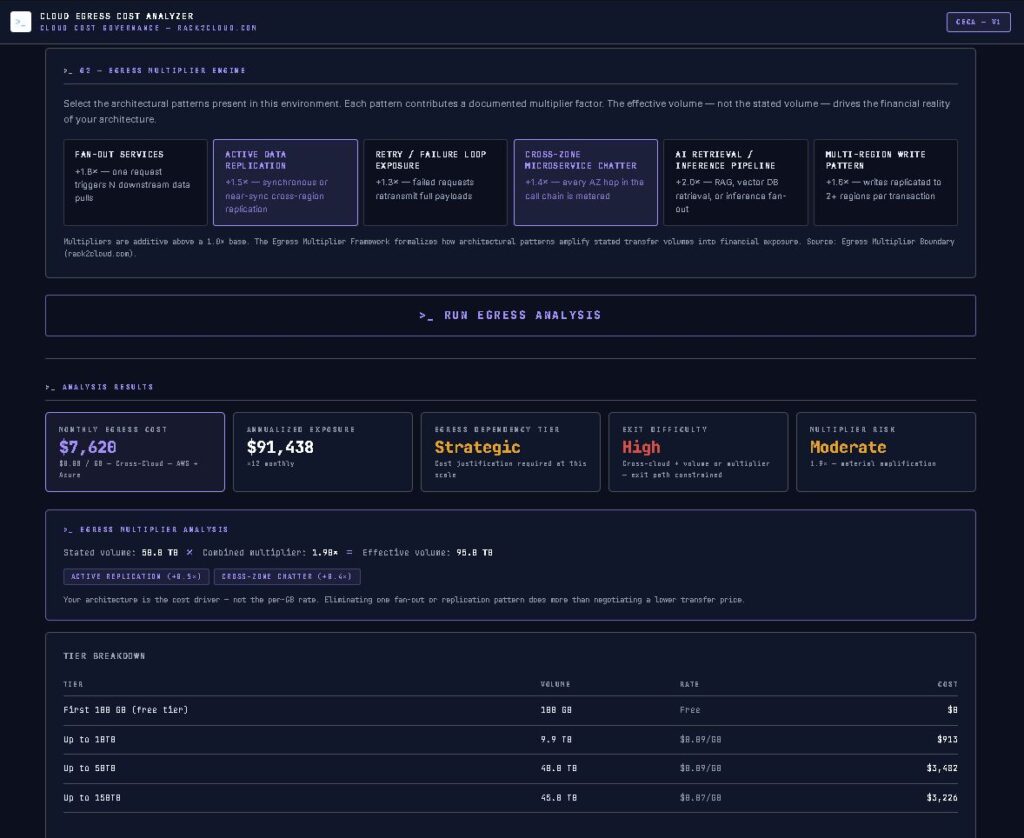
The stated transfer volume is rarely the financial reality. Architectural patterns amplify stated volume into effective volume — and the effective volume is what the bill reflects. A 50 TB/month workload running an AI inference retrieval pipeline with active cross-region replication does not cost 50 TB. It costs the egress equivalent of the effective volume those patterns produce.
The Egress Multiplier Engine formalizes this. Select the patterns present in your architecture and CECA applies each factor additively above a 1.0× base — exposing the gap between what you planned to transfer and what you are actually paying to move.
Fan-Out Services — +0.8×
One request triggers N downstream service calls, each pulling data independently. The volume you stated is one transfer. The volume billed is that transfer multiplied by the fan-out factor.
Active Data Replication — +0.5×
Synchronous or near-synchronous cross-region replication doubles the egress footprint of every write. DR architectures built on continuous replication are paying egress on both the primary write path and the replication stream.
Retry / Failure Loop Exposure — +0.3×
Failed requests that retransmit full payloads on retry are billing egress on both the failure and the retry. In high-latency or high-error-rate environments, retry storms can materially inflate the effective transfer volume.
Cross-Zone Microservice Chatter — +0.4×
Every Availability Zone hop in a microservice call chain is metered. Service mesh architectures with deep call graphs across multiple AZs generate cross-zone transfer volume that is invisible at the application layer and visible only at billing time.
AI Retrieval / Inference Pipeline — +1.0×
RAG architectures, vector database retrievals, and inference fan-out patterns pull data on every inference request. At production inference volumes, the retrieval layer alone can double or triple the effective transfer volume relative to the raw model input size.
Multi-Region Write Pattern — +0.6×
Writes replicated to two or more regions per transaction generate egress on every replication path. Active-active and active-passive multi-region architectures pay egress proportional to their replication topology — not just their user-facing transfer volume.
Architecture Scenario Reference
The following scenarios illustrate how CECA output translates to architectural action. Numbers reflect current public on-demand list pricing with representative multiplier selections.
50 TB stated volume. Active replication + multi-region writes applied. Effective volume: 105 TB. Monthly cost: ~$8,900. Tier: Strategic. Exit Difficulty: High. Break-even triggers.
50 TB stated. AI retrieval + fan-out applied. Effective volume: ~140 TB. Monthly: ~$14,800. Tier: Lock-In Risk. Exit Difficulty: High. Annual exposure: $177,600.
100 TB stated. No multipliers. Inter-region rate. Monthly: ~$2,048. Tier: Strategic. Exit Difficulty: Moderate. Query-in-place evaluation warranted.
200 TB one-time transfer. Cross-cloud internet rate. Total cost: ~$16,200. Single-event exposure — compare against Snowball at this volume (~$2,500 for 80TB device). Physical transport likely wins.
Key Features
- Tiered pricing waterfall engine: Models the actual per-provider pricing structure across all transfer path types — not a flat-rate estimate. AWS, Azure, and GCP list pricing as of 2026, including the free first-100GB tier where applicable.
- Egress Multiplier Engine: Six selectable architectural patterns, each contributing a documented additive multiplier factor. Surfaces effective volume alongside stated volume so the cost driver is visible — the pattern, not the rate.
- Egress Dependency Tier classification: Six-tier output from Baseline to Repatriation Candidate based on monthly cost thresholds and transfer pattern. Each tier carries a distinct architectural implication beyond the cost number.
- Exit Difficulty Rating: Four-level signal (Low / Moderate / High / Critical) scored on provider pattern, volume, and combined multiplier. Converts egress cost into a cloud mobility indicator — measuring the financial friction your current topology creates for future change.
- Client-Side Only: No data leaves the browser. No telemetry, no server-side logging, no account required. All pricing logic, multiplier calculation, and tier classification runs locally in your session.
THE ANALYZER SURFACES THE EXPOSURE.
A REVIEW CHANGES THE ARCHITECTURE.
Egress cost is an architecture decision made upstream — data locality, replication topology, interconnect design, and exit path. An Infrastructure Architecture Review maps what needs to change and builds the business case for the change.
|
>_ Architectural Guidance
Infrastructure Architecture ReviewWhen CECA surfaces Lock-In Risk or Repatriation Candidate tiers, the conversation shifts from cost management to architecture intervention — egress reduction, interconnect design, or repatriation planning.
|
>_ The Dispatch
Architecture Playbooks. Field-Tested Blueprints.Cloud cost governance, egress architecture, repatriation economics, and exit strategy — the frameworks that move the number, not just report it.
Zero spam. Unsubscribe anytime. |
Frequently Asked Questions
Q: What does the Cloud Egress Cost Analyzer actually measure?
A: CECA measures the financial exposure of your data movement architecture — not just the rate you are paying, but the effective volume your architectural patterns produce. It calculates monthly egress cost using provider tiered pricing waterfalls, applies the Egress Multiplier Engine to surface effective volume after architectural amplification, and outputs a dependency tier classification and exit difficulty rating alongside the cost number. The goal is to surface the architecture signal behind the billing number before that number appears on an invoice.
Q: How is this different from a standard egress calculator?
A: Standard egress calculators multiply stated volume by a flat or tiered rate. CECA applies the Egress Multiplier Engine — a structured model of the architectural patterns that amplify stated transfer volume into effective volume. Fan-out services, active replication, retry loops, cross-zone microservice chatter, AI retrieval pipelines, and multi-region writes each contribute a documented multiplier factor. The result is an effective volume figure that reflects what the architecture is actually doing, not what the initial capacity plan assumed. CECA also surfaces exit difficulty as an architecture signal — converting egress cost into a cloud mobility indicator.
Q: What providers and transfer paths does CECA cover?
A: CECA models AWS, Azure, and GCP across six regions per provider, covering major US, European, and Asia-Pacific locations. Transfer path detection is automatic: intra-region transfers (same provider, same region) are free and classified accordingly; inter-region transfers (same provider, different region) apply backbone rates; cross-cloud transfers (different providers) apply internet egress rates — the most expensive tier. All pricing is based on current public on-demand list rates and does not account for private pricing agreements, EDPs, or committed-use discounts.
Q: When does the Private Interconnect Break-Even analysis fire?
A: The break-even analysis surfaces when CECA detects High or Critical exit difficulty, or when the Egress Dependency Tier reaches Lock-In Risk or Repatriation Candidate. It compares current annualized egress cost against an estimated private circuit cost — AWS Direct Connect, Azure ExpressRoute, or GCP Dedicated Interconnect — with a savings delta. Default circuit cost estimates are built in per provider; you can override with your specific circuit cost to model an actual procurement scenario. As a general threshold, sustained cross-cloud or inter-region transfers above 50–100 TB/month typically reach private interconnect cost parity within 12 months.
Q: How accurate are the egress multiplier factors?
A: The multiplier factors are calibrated estimates derived from observed architectural behavior, not empirical billing data from specific production environments. Each factor is documented with its mechanism — fan-out, replication overhead, retry transmission, cross-zone metering, AI retrieval amplification, and multi-region write replication. They are additive above a 1.0× base. The intent is not to produce a billable-accurate number but to surface the order-of-magnitude gap between stated volume and effective volume that architectural patterns create. In architectures with multiple active patterns, the combined multiplier frequently exceeds 3–5×, consistent with reported billing anomalies in high-complexity cloud deployments.
Q: Is any data sent to a server or stored?
A: No. All pricing logic, multiplier calculation, tier classification, and break-even analysis runs entirely in your browser session using vanilla JavaScript. No data is transmitted, logged, or stored. No account is required. No cookies are set. The tool resets completely on page reload.
What is the Egress Multiplier Boundary framework?
The Egress Multiplier Boundary is a rack2cloud named framework that formalizes the relationship between architectural patterns and their financial amplification effect on data transfer costs. It defines the multiplier sources — fan-out, replication, retry, cross-zone chatter, AI retrieval, and multi-region writes — and establishes that the financial boundary of an egress architecture is determined not by the per-GB rate but by the combined multiplier factor of the patterns operating within it. CECA is the diagnostic implementation of this framework. The companion post and framework registry entry will be linked here on publication.
🔒 Privacy Architecture: No cookies. No tracking pixels. No server-side database.
This logic runs entirely in your local browser session.