It’s Not DNS (It’s MTU): Debugging Kubernetes Ingress
- Pods are
Runningandport-forwardworks, but the public URL returns502/504. - Small requests (like health checks) succeed, but large JSON payloads hang and time out.
- You see random timeout bursts or asymmetric routing failures during peak load.
- Ingress logs show
upstream prematurely closed connection.
This is Part 3 of the Rack2Cloud Diagnostic Series, where we debug the silent killers of Kubernetes reliability. If you haven’t read the strategic overview of how all four loops interact and cascade, start with The Rack2Cloud Method: A Strategic Guide to Kubernetes Day 2 Operations.

YouYou deploy your application. The pods are Running. kubectl port-forward works perfectly. You open the public URL, expecting success.
502 Bad Gateway. Kubernetes Ingress 502 errors are rarely what they appear to be.
Or maybe: 504 Gateway Timeout, upstream prematurely closed connection, connection reset by peer, no healthy upstream.
Welcome to the Networking Illusion. In Kubernetes, “Network Connectivity” is a stack of abstractions. The error message you see is rarely the error that actually happened.
For Azure environments specifically, the NAT Gateway SNAT exhaustion that produces these symptoms under load — and how it differs from the AWS ALB pattern — is mapped in detail in Petro Kostiuk’s Azure Edition of the Rack2Cloud Method.
The False Reality Stack: The “Bridge” Lie
Engineers think of Ingress as a simple bridge — traffic hits the Load Balancer and goes directly to the Pod. That mental model is wrong, and it’s why 502 debugging takes so long.
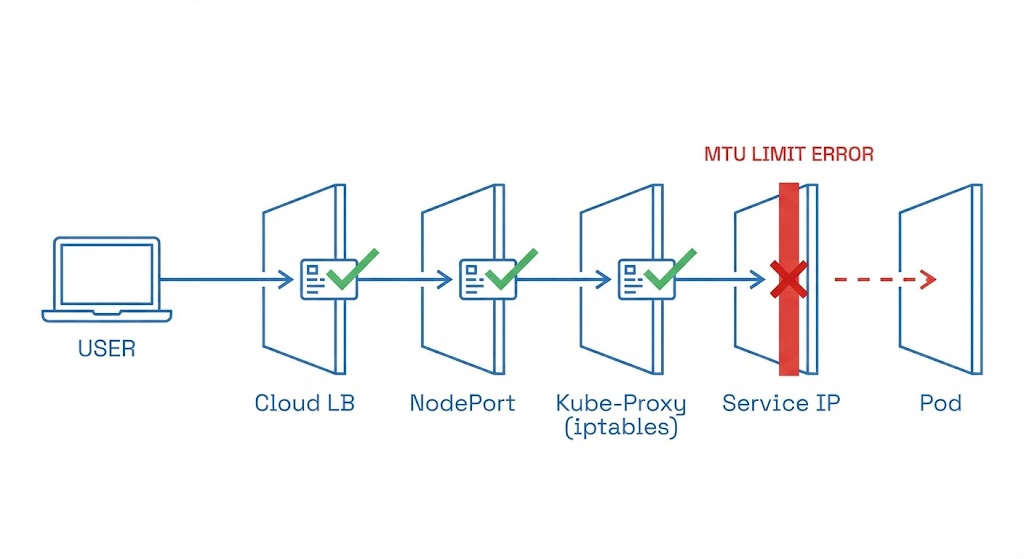
ThIngress is five different networks pretending to be one. If any single handshake fails, the entire chain collapses and the Load Balancer returns a generic 502:
- Client → Cloud Load Balancer (AWS ALB / Google GLB / Azure Application Gateway)
- LB → NodePort (the VM’s physical port)
- NodePort → kube-proxy / iptables (Linux kernel routing)
- iptables → Service IP (virtual cluster IP)
- Service → Pod (the overlay network)
If port-forward works, Layer 5 is confirmed healthy. The problem is in Layers 1 through 4. This is the diagnostic constraint that eliminates half the search space immediately — and most engineers don’t use it.
The private endpoint configuration that governs Layer 1 for Azure-hosted clusters — and how misconfigured VPC endpoint policies silently drop traffic before it reaches the NodePort — is covered in the Azure Private Endpoint Auditor.
Health Check Mismatch: The #1 Cause of Kubernetes Ingress 502 Errors
Your app is running perfectly. The Load Balancer thinks it’s dead.
The Trap: Cloud Load Balancers do not check your Pod directly. They check the NodePort. Kubernetes readinessProbe checks the Pod inside the cluster. These are two different health check universes that never compare notes.
The Failure Scenario:
- Pod returns
200 OKat/health/api - Ingress Controller is configured to check
/ - App returns
404at/ - Load Balancer sees
404, marks the backend as Unhealthy, cuts the connection
The Fix: Ensure your livenessProbe, readinessProbe, and Ingress healthCheckPath all point to the same endpoint that returns a consistent 200. Three different health check endpoints pointing at three different paths is not defense in depth — it’s three different ways to fail silently.
The Host Header Trap: The Classic Engineer Mistake
You try to debug by curling the Load Balancer IP directly. It returns 404. You panic and start questioning the entire deployment.
The Command You Ran:
Bash
curl http://35.192.x.x
> 404 Not Found
The Reality: Your Ingress Controller (likely NGINX) is a virtual host router. It inspects the Host header to decide where to route traffic. If you hit the IP directly without a Host header, it doesn’t know which application you want — so it drops you with a 404.
The Fix: Spoof the header when testing:
Bash
curl -H "Host: example.com" http://35.192.x.x
If this returns the expected response, your networking is fine — you have a DNS propagation issue, not an infrastructure problem.
As Petro Kostiuk outlines in his Azure Edition of the Rack2Cloud Method, when your application is healthy but unreachable from the internet, you are debugging the Network Loop — and the Azure-specific failure modes differ meaningfully from AWS.
- The Primitives: Azure CNI (or Cilium where adopted), Ingress controller tuning, NAT Gateway/SNAT capacity planning, Network Policies + NSGs, Private Endpoints and DNS hygiene
- The Anti-Pattern: Assuming “service reachable” means the network is healthy — and not planning SNAT port allocation before hitting production load
- The Symptom: 502/504 spikes, random timeout bursts, asymmetric failures — often caused by SNAT port exhaustion when scaling out without a NAT Gateway
- The Day 2 Rule: Network is eventual consistency plus translation layers. Validate the path, not just the endpoint. Document and enforce your egress strategy before you need it.
The MTU Blackhole: The Silent Killer
This is the failure mode that separates junior admins from senior SREs. Small requests work — login pages, health checks, API handshakes. But large JSON responses hang indefinitely and time out.
The Cause: Kubernetes overlay networks (VXLAN, Geneve) wrap your data in extra protocol headers — typically 50 bytes of overhead. Standard Ethernet MTU is 1500 bytes. Your overlay packet is 1550 bytes. When this oversized packet tries to leave the node, the physical network says “Too Big.”
Normally, routers fragment the packet and reassemble at the destination. But most cloud networks (AWS, GCP, Azure) drop fragmented packets entirely for performance reasons. The packet disappears silently. No error. Just a timeout.
The Test:
The Test:
Bash
# Force a small MTU to test connectivity
curl --limit-rate 10k https://site.com

# Test the "large body" hang
curl -v https://site.com/large-json-endpoint
The Fix: Lower the MTU on your CNI (Calico/Flannel/Cilium) to 1450, or enable Jumbo Frames on your VPC if your underlying network supports it. The CNI configuration change requires a rolling restart of the CNI pods — plan for a brief connectivity disruption on each node.
The same packet fragmentation physics that cause MTU blackholes in Kubernetes overlays apply to cross-AZ traffic in sovereign and disconnected environments. See the Sovereign Infrastructure Strategy Guide for how network path validation changes when the public internet is not available as a fallback.
TLS Termination Mismatch
You see this in your Ingress Controller logs: SSL routines:ssl3_get_record:wrong version number
The Cause: A protocol mismatch at the termination boundary:
- Scenario A: The Load Balancer terminates TLS and sends plain HTTP to the pod — but your pod expects HTTPS
- Scenario B: Double encryption is enabled but the Ingress annotation is missing, so the controller sends HTTP to a pod expecting HTTPS
The Fix: Check your Ingress annotations explicitly:
YAML
nginx.ingress.kubernetes.io/backend-protocol: "HTTPS"
Never assume the default — check what protocol the annotation is actually set to, not what you believe you set it to.
Advanced: Connection Tracking (Conntrack) Exhaustion
This one surfaces in high-traffic production incidents. Random 502 errors during peak load. CPU and memory are both fine. No obvious resource pressure. The cluster looks healthy.
Linux maintains a conntrack table to track NAT entries. Massive volumes of short-lived connections — PHP or Node.js services without HTTP keep-alive, for example — fill this table. When it’s full, new connections are silently dropped.
The Log:
Bash
dmesg | grep conntrack
> nf_conntrack: table full, dropping packet
The Fix: Tune net.netfilter.nf_conntrack_max via sysctl, or enable HTTP keep-alive to reuse connections and reduce conntrack churn. The keep-alive fix is almost always faster to implement and more durable than tuning kernel parameters under load.
The IaC governance framework for applying sysctl tuning consistently across node groups — without introducing configuration drift between node pools — is in the Modern Infrastructure & IaC Learning Path.
The Rack2Cloud Diagnostic Protocol: 5 Phases
Networking debugging is usually panic-driven. Stop guessing. Run these commands in order. Each phase eliminates one layer of the failure stack.
Phase 1: Inside the Cluster (The Control)
Goal: Prove the application is actually running and reachable internally.
Bash
# syntax: bash
# Replace <pod-name> with a debug pod (like curl-client)
kubectl exec -it <debug-pod> -- curl -v http://<service-name>
- ✅ Works → App and Service Discovery (DNS) are confirmed healthy. Move to Phase 2.
- ❌ Fails → Stop looking at the Ingress. The application is dead or the Service selector is misconfigured.
Phase 2: The Service Glue
Goal: Prove Kubernetes knows where your pods are.
Bash
# syntax: bash
kubectl get endpoints <service-name>
- ✅ IP addresses listed → Service discovery is working.
- ❌ <none> or empty → Your Service selector labels do not match your Pod labels. This is the fix before anything else.
Phase 3: The NodePort (The Hardware Interface)
Goal: Prove traffic can enter the VM.
Bash
# syntax: bash
# Get the NodePort first
kubectl get svc <service-name>
# Curl the Node IP directly
curl -v http://<node-ip>:<node-port>
- ✅ Works → kube-proxy and iptables are functioning correctly.
- ❌ Fails → Your Cloud Firewall (AWS Security Group / Azure NSG) is blocking the NodePort, or kube-proxy has crashed on this node.
Phase 4: The Load Balancer (The Host Trap)
Goal: Prove the Ingress Controller is routing correctly.
Bash
# syntax: bash
# Do NOT just curl the IP. You must spoof the Host header.
curl -H "Host: example.com" http://<load-balancer-ip>
- ✅ Works → Ingress Controller is healthy and routing correctly.
- ❌ 404/503 → Ingress host or path rules are wrong. The controller received the packet but didn’t know which application it was for.
Phase 5: The Internet (The Silent Killers)
Goal: Prove the pipe is big enough.
Bash
# syntax: bash
# Test for MTU issues (Small header works?)
curl --head https://example.com
# Test for Fragmentation (Large body hangs?)
curl https://example.com/large-asset
- ❌ Fails only at this phase → MTU packet drop, WAF blocking the request, or DNS propagation lag. Not an application problem.
Summary: Networking Failures are Location Problems
When you see a 502, don’t blame the code. Trace the packet. The five-phase protocol above eliminates one network layer per step — run it in order and you will find the failure layer before you’ve written a single line of debug code.
Continue to Part 4: Storage Has Gravity — Debugging PVCs & AZ Lock-in, the final part of the series, where the same cross-loop cascade pattern produces a storage deadlock that looks like a network timeout.
ping -M do -s 1472 from pod to pod across nodes. Silent packet fragmentation produces intermittent 502s that look like application failures — and only appear under large payload load.livenessProbe, readinessProbe, and Ingress healthCheckPath must all point to the same endpoint returning a consistent 200. Three different paths = three independent ways to fail silently.proxy-read-timeout and proxy-send-timeout on every Ingress resource. Default timeout values are sized for Hello World — not long-running database queries or AI inference endpoints.nf_conntrack_max. Keep-alive reduces connection churn at the source — kernel tuning just raises the ceiling before the next incident.Stop Blaming the Code. Trace the Packet.
The complete Kubernetes Day 2 Diagnostic Playbook covers all four loop failure protocols — including the full Network Loop 5-phase diagnostic with exact kubectl commands, MTU validation scripts, and conntrack tuning reference. Includes Petro Kostiuk’s Azure Day 2 Readiness Checklist.
↓ Download The Kubernetes Day 2 Diagnostic PlaybookMaster the Day-2 operations of Kubernetes by diagnosing the foundational failures the documentation doesn’t cover.
Additional Resources
Editorial Integrity & Security Protocol
This technical deep-dive adheres to the Rack2Cloud Deterministic Integrity Standard. All benchmarks and security audits are derived from zero-trust validation protocols within our isolated lab environments. No vendor influence.
R.M.
Senior Solutions Architect with 25+ years of experience in HCI, cloud strategy, and data resilience. As the lead behind Rack2Cloud, I focus on lab-verified guidance for complex enterprise transitions. View Credentials →
Get the Playbooks Vendors Won’t Publish
Field-tested blueprints for migration, HCI, sovereign infrastructure, and AI architecture. Real failure-mode analysis. No marketing filler. Delivered weekly.
Select your infrastructure paths. Receive field-tested blueprints direct to your inbox.
- > Virtualization & Migration Physics
- > Cloud Strategy & Egress Math
- > Data Protection & RTO Reality
- > AI Infrastructure & GPU Fabric
Zero spam. Includes The Dispatch weekly drop.
Need Architectural Guidance?
Unbiased infrastructure audit for your migration, cloud strategy, or HCI transition.
>_ Request Triage Session