Your Monitoring Didn’t Miss the Incident. It Was Never Designed to See It.
I’ve watched observability vs monitoring play out as a live incident more times than I can count.
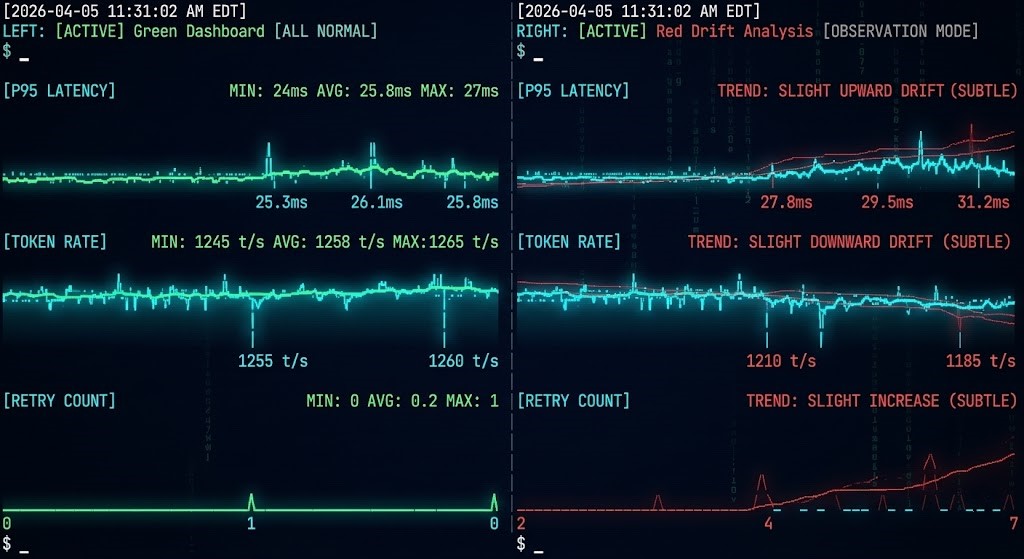
The dashboard was green. The on-call engineer was not paged. The monitoring system did exactly what it was designed to do — it watched for thresholds, waited for metrics to cross them, and stayed silent when they didn’t.
The problem is that modern systems don’t fail by crossing thresholds anymore.
They fail by behaving differently.
Latency doesn’t spike — it drifts. Error rates don’t explode — they scatter. Cost doesn’t surge in a single event — it compounds across thousands of small decisions.
By the time a traditional alert fires, the system hasn’t just degraded — it has already crossed the point where recovery is simple.
This is not a tooling gap. It is a model mismatch.
Your monitoring stack was built for systems that fail loudly. Your systems now fail quietly.
Observability vs Monitoring: The Model Difference
Monitoring answers a binary question: did something break?
Observability answers a different question: is something becoming broken?
Those are not the same question. They require different instrumentation, different signal design, and a different mental model for what “healthy” means.
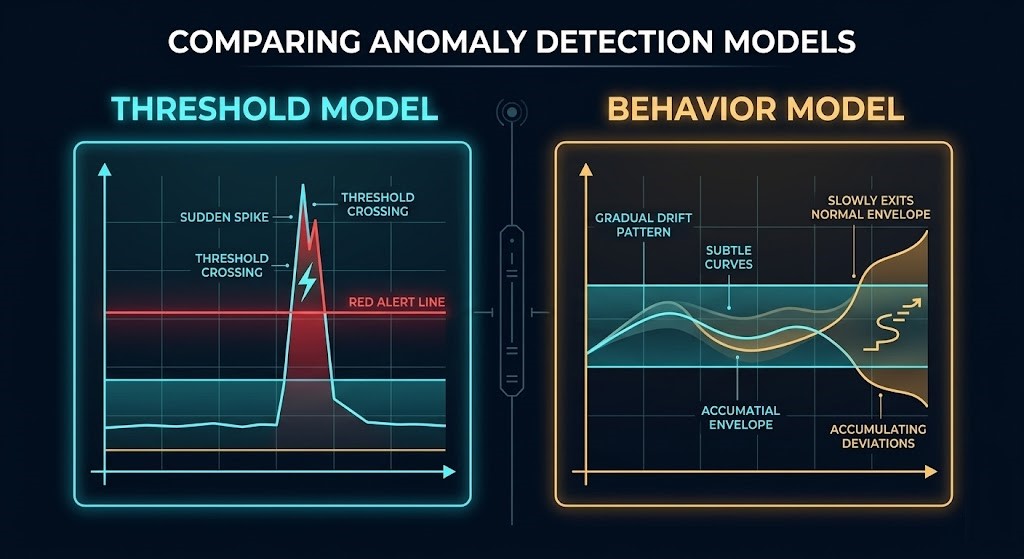
Threshold monitoring was the right model for a specific class of system. A server goes down — the metric crosses the line, the alert fires, the engineer responds. The model held because the systems it watched failed that way.
Modern distributed systems don’t. A microservice doesn’t go down — it slows down, inconsistently, for a subset of requests. An AI inference pipeline doesn’t stop — it starts making more expensive routing decisions, one request at a time. A Kubernetes cluster doesn’t fail — it starts scheduling less efficiently as resource pressure builds across nodes.
None of those conditions cross a threshold. They shift a distribution. And a monitoring system built on threshold logic will report green on a system that is actively degrading — not because the tooling is broken, but because it is measuring the wrong thing.
This is the architectural consequence of the observability vs monitoring gap: the systems that need the most visibility are the ones least well served by traditional alerting. The pattern of systems drift before they break is invisible to threshold logic — it’s a directional change that compounds over time until recovery becomes expensive.
What Modern Failure Looks Like
The clearest way to understand the model mismatch is to look at what failure actually looks like in production today.
In AI inference systems, failure rarely announces itself. Token consumption increases gradually as retrieval steps get added without corresponding cleanup. Model routing shifts toward more expensive paths as confidence thresholds drift. Retry logic fires more frequently as upstream latency increases, amplifying load on already-stressed components. None of these generate alerts. All of them generate cost. The pattern is consistent: inference cost emerges from behavior, not provisioning — and behavior-driven cost is invisible to systems that only watch provisioned resources.
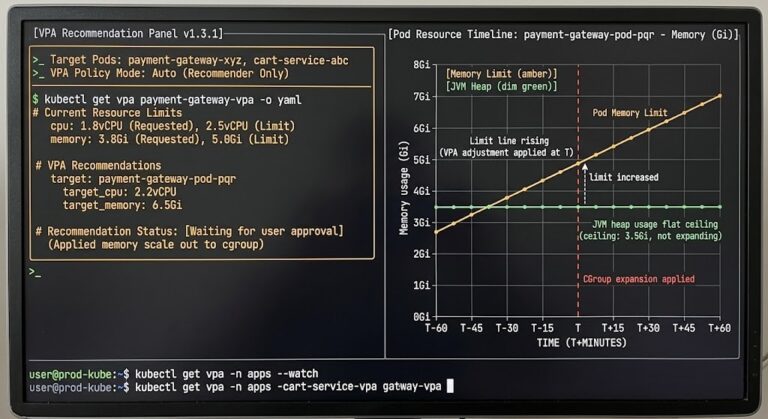
In Kubernetes environments, the infrastructure layer stays deceptively healthy while the workload layer degrades. CPU and memory utilization appear normal. Pod restarts are within tolerance. The cluster health check returns green. Meanwhile, P95 latency is climbing, request fan-out is increasing, and a specific subset of services is approaching saturation. Kubernetes surfaces infrastructure state, not behavioral drift — the gap between “the cluster is healthy” and “the application is degrading” is exactly where modern incidents live.
In distributed systems broadly, the failure pattern is compounding deviation. Small inefficiencies accumulate. A cache miss rate that climbs two percent per week. A retry rate that increases slightly after each deployment. A batch pipeline that takes a few seconds longer on each run. Individually, none of these register. Together, they describe a system moving steadily toward a failure state — and infrastructure-level metrics can remain stable while system behavior degrades.
The common thread: the system looks healthy until it doesn’t. And when it doesn’t, the failure isn’t new — it’s the accumulated result of a drift that started weeks earlier.
Where Cost Visibility Breaks
Cost is one of the clearest signals of behavioral drift — and one of the most consistently misread.
Traditional cost monitoring watches spend. When the bill increases, an alert fires. The problem is that cost is a lagging indicator. By the time it appears in your billing dashboard, the behavior that generated it has been running for days, sometimes weeks.
The gap is precise: cost appears in billing before it appears in monitoring. Most stacks have no instrumentation layer between the behavior that drives cost and the invoice that reports it.
For AI systems, this gap is structurally worse. Execution budgets enforce limits at runtime — but a budget you can’t see being consumed is a budget that will be exceeded before you know it’s at risk. Token burn rate, model selection frequency, retry amplification across inference calls — these are the behavioral signals that predict cost trajectory. None of them appear in a billing alert.
The fix isn’t better billing alerts. It’s instrumentation that captures cost-generating behavior at the point where it occurs — before it aggregates into a charge.
Why AI Systems Amplify the Problem
AI inference systems don’t just expose the observability gap — they widen it.
The core reason is that model routing decisions depend on runtime signals. A well-designed routing layer directs simple requests to lightweight models and escalates complex ones. But that routing logic depends on runtime signals — confidence scores, query complexity, context length — that are invisible to traditional monitoring infrastructure.
When routing starts shifting — more requests escalating to expensive models, fallback paths activating more frequently, confidence thresholds drifting — the observability stack sees none of it. CPU utilization stays flat. Memory pressure stays normal. The only signal is in the routing decisions themselves, and most infrastructure teams have no instrumentation on that layer.
This creates a specific failure mode: the system is technically healthy, operationally degrading, and generating increasing cost — and the monitoring stack cannot see any of it because it was never instrumented to watch decision patterns, only resource consumption.
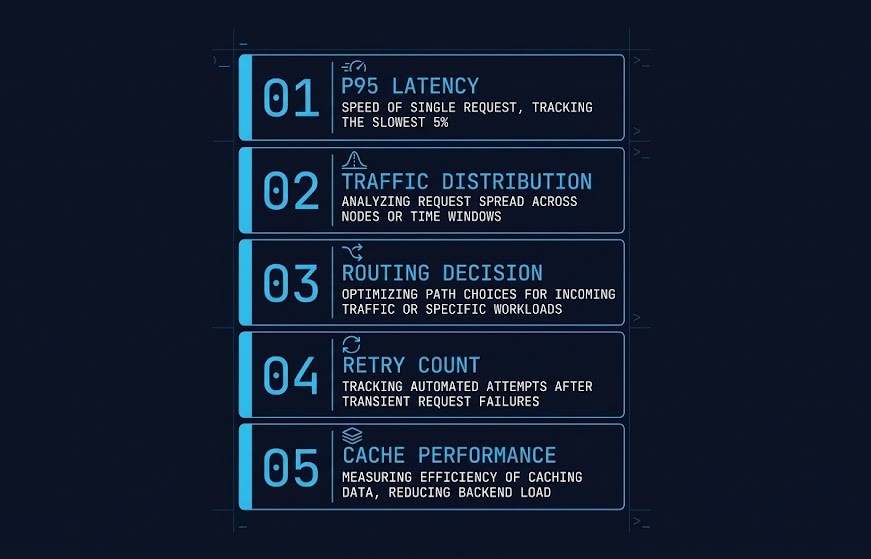
The 5 Signals That Predict Failure Before It Happens
Modern systems don’t give you a single failure signal. They give you patterns — subtle, compounding deviations from expected behavior. These are the signals that appear before the incident, not during it.
What to Instrument
Knowing the signals is necessary. Knowing where to capture them is the operational question. Four instrumentation points close the majority of the observability vs monitoring gap for modern AI and distributed systems.
The Infrastructure Looks Healthy
This is the most operationally dangerous state a system can be in.
Every infrastructure metric is within tolerance. The cluster health check returns green. The dashboard shows normal utilization across compute, memory, and network. There are no open incidents.
Meanwhile, P95 latency has climbed 40% over the past two weeks. Token burn rate has increased 22%. The fallback routing path is activating three times more frequently than it was last month. A cache layer is operating at 61% hit rate, down from 89%.
None of those conditions crossed a threshold. All of them are signals.
The failure isn’t coming. It’s already in progress. The monitoring stack just doesn’t have the observability layer to surface it.
Architect’s Verdict
The observability gap in modern AI and distributed systems is not a tooling problem — it is a model problem. Threshold-based monitoring was designed for systems that fail discretely and loudly. Modern systems fail continuously and quietly. The five signals covered here — consumption velocity, distribution drift, decision pattern changes, retry amplification, and cache miss rate — are not exotic telemetry. They are the behavioral layer that sits between “infrastructure looks healthy” and “system is degrading.” Instrumenting that layer requires extending beyond resource metrics into trace data, inference middleware, and call-level cost telemetry. The architects who build that instrumentation layer before an incident are the ones who catch drift before it compounds into a crisis. The ones who wait for a threshold to cross will keep explaining why the dashboard was green when the system was already failing. You don’t need more alerts. You need different signals.
Additional Resources
Editorial Integrity & Security Protocol
This technical deep-dive adheres to the Rack2Cloud Deterministic Integrity Standard. All benchmarks and security audits are derived from zero-trust validation protocols within our isolated lab environments. No vendor influence.
R.M.
Senior Solutions Architect with 25+ years of experience in HCI, cloud strategy, and data resilience. As the lead behind Rack2Cloud, I focus on lab-verified guidance for complex enterprise transitions. View Credentials →
Get the Playbooks Vendors Won’t Publish
Field-tested blueprints for migration, HCI, sovereign infrastructure, and AI architecture. Real failure-mode analysis. No marketing filler. Delivered weekly.
Select your infrastructure paths. Receive field-tested blueprints direct to your inbox.
- > Virtualization & Migration Physics
- > Cloud Strategy & Egress Math
- > Data Protection & RTO Reality
- > AI Infrastructure & GPU Fabric
Zero spam. Includes The Dispatch weekly drop.
Need Architectural Guidance?
Unbiased infrastructure audit for your migration, cloud strategy, or HCI transition.
>_ Request Triage Session