Your Kubernetes Cluster Isn’t Out of CPU — The Scheduler Is Stuck
- Grafana shows cluster CPU utilization is under 50%, but pods are stuck in
Pending. - Events show:
0/10 nodes are available: 10 Insufficient cpu. - Events show:
pod didn't trigger scale-up (it wouldn't fit if a new node is added). - Node drain operations hang indefinitely during cluster upgrades.
This is Part 2 of the Rack2Cloud Diagnostic Series, where we debug the silent killers of Kubernetes reliability. If you haven’t read the strategic overview of how all four loops interact and cascade, start with The Rack2Cloud Method: A Strategic Guide to Kubernetes Day 2 Operations.

Your Grafana dashboard says the cluster is only 45% used. Finance keeps pinging you about cloud waste. Meanwhile, kubectl get pods shows a queue of Pending pods.
You are not out of capacity. You are losing at Kubernetes Tetris.
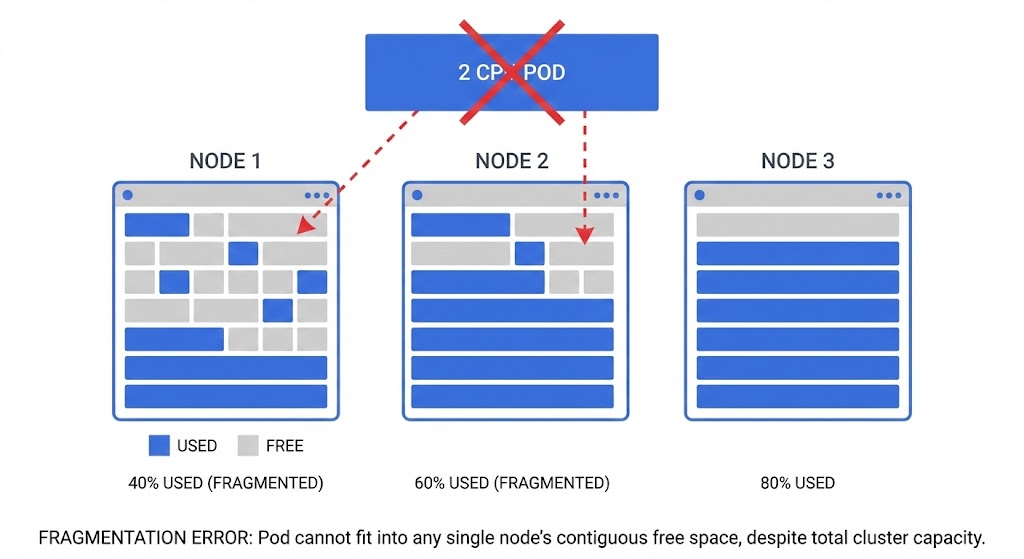
In Kubernetes, “Total Capacity” is mostly for show. What really matters is Allocatable Continuity. Ten nodes with 1 CPU free on each gives you 10 CPUs on paper — but if you need to schedule a pod that requires 2 CPUs, you are out of luck. The scheduler doesn’t add up free space across nodes. It hunts for a single node with enough contiguous resources that also satisfies every constraint you’ve defined.
The same scheduler contention physics that produce Pending pods in Kubernetes produce CPU Ready queuing at the hypervisor layer. If you’re migrating workloads from VMware to Kubernetes and seeing unexpected Pending states, the CPU Ready vs CPU Wait guide and Resource Pooling Physics explain why the problem follows the workload across platforms.
The Dashboard Lie: “Green” Doesn’t Mean Go
When a pod gets stuck, most engineers check cluster utilization, see plenty of spare CPU, and assume there’s room. The dashboard looks green.
But the scheduler doesn’t care about the sum. It hunts for a single node that fits all constraints simultaneously. If you see these events, you don’t have a capacity problem — you have a placement problem:
0/10 nodes are available: 10 Insufficient cpu0/6 nodes are available: 3 node(s) had taint {node.kubernetes.io/unreachable}, 3 node(s) didn't match Pod's node affinitypod didn't trigger scale-up (it wouldn't fit if a new node is added)
That last one is the real trap. Even if the autoscaler provisions a new node, your affinity rules still block the pod from landing on it. More hardware doesn’t fix a policy problem.
The Fragmentation Trap (Or, The Tetris Problem)
The scheduler only cares about Requests — not actual usage. This is where most implementations break down:
The Requests vs. Limits Blind Spot
A classic mistake: thinking the scheduler cares about usage. It doesn’t. It only looks at Requests.
YAML
resources:
  requests:
    cpu: "2" # <--- Scheduler only cares about this
  limits:
    cpu: "4"
If a node has 4 CPUs and pods have requested 3.5 CPUs, the scheduler sees that node as full — even if those pods are collectively using 400m of CPU. Once requested, that seat is reserved. Actual usage is irrelevant to scheduling decisions.
The DaemonSet Tax
DaemonSets are invisible until they accumulate. Running Datadog, Fluentd, and a security agent on every node costs:
150m CPU (Datadog) + 200m CPU (Fluentd) + 100m CPU (Istio sidecar) = 450m CPU lost per node
Across 20 nodes, that’s 9 CPUs consumed — but scattered in 450m crumbs too small to satisfy most workload requests. The cluster looks 45% utilized. The scheduler sees a maze of unusable fragments.
Audit your DaemonSet requests before assuming you need more nodes. The IaC governance framework for tracking DaemonSet resource allocation across cluster upgrades is in the Modern Infrastructure & IaC Learning Path.
Running Day 2 operations as a system of intersecting control loops is critical for Azure environments. As Petro Kostiuk notes in his Azure Edition of the Rack2Cloud Method, when your AKS cluster feels out of capacity but metrics say otherwise, you have lost control of the Compute Loop.
- The Primitives: Node pools with enforced system/user separation, Cluster Autoscaler/KEDA, PriorityClass, PodDisruptionBudgets, and explicit Requests/Limits on every workload
- The Anti-Pattern: Missing or unrealistic Requests/Limits — the scheduler guesses and guesses wrong
- The Symptom: Pending pods, unstable autoscaling, noisy neighbor contention
- The Day 2 Rule: Scheduling is a budget system. If budgets are wrong, the scheduler lies to you.
The Silent Killer: Pod Disruption Budgets (PDBs)
PDBs are designed to keep your application safe during upgrades. But configured too strictly, they create a deadlock that stops the entire cluster from making progress.
The Scenario: You attempt to drain a node for a Kubernetes upgrade. The drain hangs indefinitely.
The Cause: minAvailable: 100% (or equivalently maxUnavailable: 0):
YAML
apiVersion: policy/v1
kind: PodDisruptionBudget
metadata:
  name: app-pdb
spec:
  minAvailable: 100%  # <--- The Trap
  selector:
    matchLabels:
      app: web
Three replicas, PDB says all three must always be running. Kubernetes cannot move a pod to drain the node. Cluster Autoscaler cannot scale down. The node upgrader cannot drain. Everything stops.
The Fix: Always leave room to maneuver. Use maxUnavailable: 1 or minAvailable: 90%. If you have a single-replica workload, the PDB conversation starts with “why is this not running at least 2 replicas?”
Topology Spread: The Strict Trap
Zone spreading is correct HA practice — until whenUnsatisfiable: DoNotSchedule turns a preference into a hard outage:
YAML
topologySpreadConstraints:
  - maxSkew: 1
    topologyKey: topology.kubernetes.io/zone
    whenUnsatisfiable: DoNotSchedule  # <--- The Hard Stop
    labelSelector:
      matchLabels:
        app: web
The deadlock scenario:
- AZ-A has 2 pods, AZ-B has 2 pods, AZ-C is full
- You schedule a 5th pod
- Adding to AZ-A or AZ-B breaks the maxSkew: 1 rule
- AZ-C is packed
- Pod sits in Pending indefinitely — despite open capacity in AZ-A and AZ-B
The Fix: Use whenUnsatisfiable: ScheduleAnyway unless you have a hard regulatory requirement for perfect AZ symmetry. Prefer availability over topology perfection. A running pod in an unbalanced zone beats a Pending pod in a perfectly balanced queue.
Advanced: Scheduler Cache Lag
The scheduler doesn’t query the live state of every node on every scheduling decision — that would be prohibitively slow. Instead it uses a snapshot cache.
In high-churn environments — nodes scaling rapidly, pods dying and spawning — the cache can lag by a few seconds. The scheduler assigns a pod to Node A based on a stale snapshot. Node A’s Kubelet rejects the pod because it’s actually full. The pod returns to the scheduling queue.
This surfaces as intermittent FailedScheduling events that vanish seconds later. It’s not a bug — it’s an eventual-consistency behavior of the scheduling cache. But knowing it exists prevents 20 minutes of debugging a self-resolving race condition.
Summary: Capacity Problems Are Policy Problems
If your dashboard says you have CPU but your pods are Pending, stop buying nodes. You don’t need more hardware. You need to audit your rules:
Continue to Part 3: It’s Not DNS (It’s MTU): Debugging Kubernetes Ingress, where the same pattern — a symptom in one loop caused by a failure in another — plays out in the Network Loop.
For the cloud cost implications of scheduler fragmentation — specifically how fragmented clusters drive unnecessary node provisioning and inflate cloud bills — see The Physics of Data Egress and the Cloud Restore Calculator for infrastructure cost modeling.
maxUnavailable: 1 or minAvailable: 90%. Never set minAvailable: 100% — it creates a scheduling deadlock that blocks node drains and cluster upgrades entirely.whenUnsatisfiable: ScheduleAnyway. A running pod in an imperfect zone beats a Pending pod in a perfect queue.Stop Buying Nodes. Start Auditing Policies.
The complete Kubernetes Day 2 Diagnostic Playbook covers all four loop failure protocols — including the full Compute Loop fragmentation diagnostic with kubectl commands, PDB audit templates, and the DaemonSet tax calculator. Includes Petro Kostiuk’s Azure Day 2 Readiness Checklist.
↓ Download The Kubernetes Day 2 Diagnostic PlaybookMaster the Day-2 operations of Kubernetes by diagnosing the foundational failures the documentation doesn’t cover.
Additional Resources
Editorial Integrity & Security Protocol
This technical deep-dive adheres to the Rack2Cloud Deterministic Integrity Standard. All benchmarks and security audits are derived from zero-trust validation protocols within our isolated lab environments. No vendor influence.
R.M.
Senior Solutions Architect with 25+ years of experience in HCI, cloud strategy, and data resilience. As the lead behind Rack2Cloud, I focus on lab-verified guidance for complex enterprise transitions. View Credentials →
Get the Playbooks Vendors Won’t Publish
Field-tested blueprints for migration, HCI, sovereign infrastructure, and AI architecture. Real failure-mode analysis. No marketing filler. Delivered weekly.
Select your infrastructure paths. Receive field-tested blueprints direct to your inbox.
- > Virtualization & Migration Physics
- > Cloud Strategy & Egress Math
- > Data Protection & RTO Reality
- > AI Infrastructure & GPU Fabric
Zero spam. Includes The Dispatch weekly drop.
Need Architectural Guidance?
Unbiased infrastructure audit for your migration, cloud strategy, or HCI transition.
>_ Request Triage Session