The Physics of Disconnected Cloud: Modeling Microbursts & Metro Risk
“Your RTT is 2ms. You’re well within the Metro threshold.”
That sentence has caused more Metro cluster failures than any hardware fault. The problem isn’t the measurement. It’s what the measurement doesn’t tell you.
Average RTT is a lie. Not because the number is wrong — it’s accurate for the moment it was taken. It’s a lie because storage replication doesn’t run on averages. It runs on worst-case latency at the worst possible moment: during a rebuild event, a live migration wave, or a sudden cross-zone traffic burst.
The execution physics that govern why Metro latency is so unforgiving — specifically how synchronous replication interacts with CVM scheduling under load — are covered in Beyond the VMDK: Translating Execution Physics from ESXi to AHV. If Metro stability is in scope for your migration, start there. This post picks up where that one leaves off: what happens when the execution boundary stretches across physical distance.
Execution threads that were once nanoseconds apart are now separated by fiber, switching buffers, and the physics of light. This is the physics of disconnected cloud.
The Averaging Trap: Why P50 Latency Is Irrelevant
Most network monitoring tools report average latency. Some report P95. Almost none report what actually matters for synchronous replication: P99.9 latency under concurrent I/O load.
Here’s the problem with averages in a Metro context. Your link shows a steady 2ms average RTT across a 24-hour monitoring window. That looks healthy. Your Metro availability threshold is 5ms. You have 3ms of headroom. You feel good.
Now picture that same link during a storage rebuild event. A node fails. The surviving nodes begin re-protecting data. Replication traffic spikes. Cross-site synchronization demand doubles. For 400 milliseconds, your RTT hits 18ms — well above threshold. Witness node arbitration triggers. Your Metro cluster enters split-brain protection mode.
Your 24-hour average? Still shows 2.1ms. The monitoring dashboard looks fine. The cluster does not.
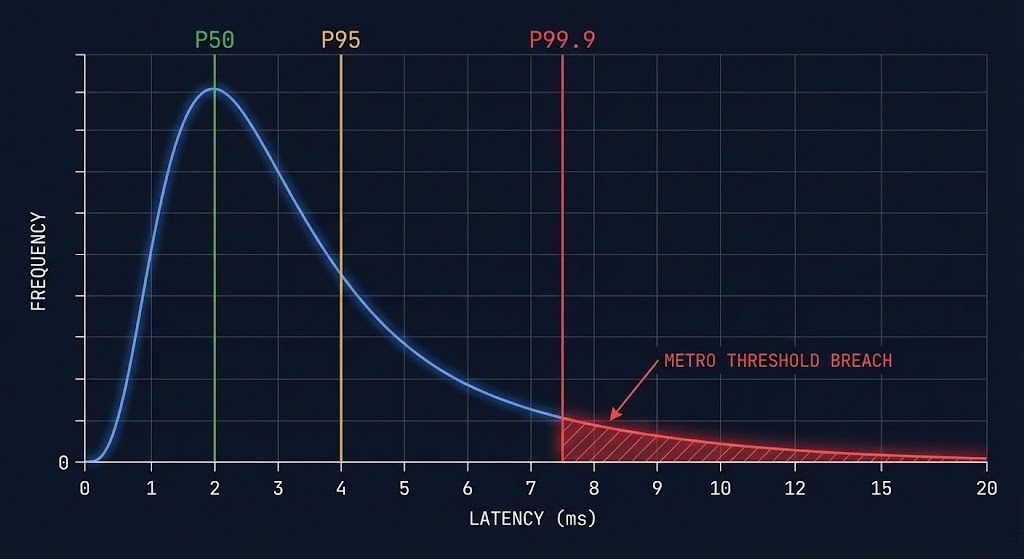
The engineering principle is simple: synchronous systems are governed by their worst case, not their average. A Metro cluster that replicates writes synchronously across sites cannot complete a write until both sites acknowledge. One slow acknowledgment — one P99.9 event — stalls the entire write path.
This is why “it passed the RTT test” is insufficient. The RTT test was run at idle. Your cluster won’t fail at idle.
The same worst-case-governs principle applies to scheduler fragmentation in Kubernetes — a Pending pod during a Compute Loop failure isn’t caused by average CPU utilization, it’s caused by the worst-case contiguous slot. The pattern is consistent across layers. See Your Cluster Isn’t Out of CPU — The Scheduler Is Stuck for how the same variance modeling approach applies one layer up the stack.
RTT vs Jitter vs Packet Loss: Three Metrics, Three Failure Modes
Network engineers often treat RTT, jitter, and packet loss as variations of the same problem. For storage replication, they are three entirely different failure modes with different causes, different thresholds, and different remediation paths.
Round-Trip Time (RTT)
The physical distance problem. RTT is largely determined by the speed of light in fiber — approximately 5ms per 1,000km. For Metro deployments, this is typically stable and predictable.
Jitter (Latency Variance)
The real killer for synchronous replication. Jitter is the variation in packet delivery time. A link with 2ms average RTT but ±8ms jitter has a worst-case envelope of 10ms — above Metro threshold — even though the average looks healthy.
Packet Loss
Amplified dramatically by TCP retransmit behavior in storage replication paths. Even 0.1% packet loss forces TCP retransmits which introduce 200-300ms recovery windows — orders of magnitude above Metro thresholds.
The critical insight: you can pass the RTT test and still fail on jitter. You can pass both RTT and jitter tests and still fail under packet loss. These are independent failure vectors. Your pre-flight validation must test all three simultaneously, under load — not sequentially at idle.
MTU misconfiguration is one of the most common sources of packet loss in Metro replication paths — the same overlay encapsulation overhead that causes Kubernetes Ingress MTU blackholes applies to cross-site replication traffic. If you’re seeing unexplained packet loss in your Metro validation, the It’s Not DNS (It’s MTU): Debugging Kubernetes Ingress post covers the path validation methodology that applies directly to this failure mode.
The Microburst Problem: What Your Monitoring Misses
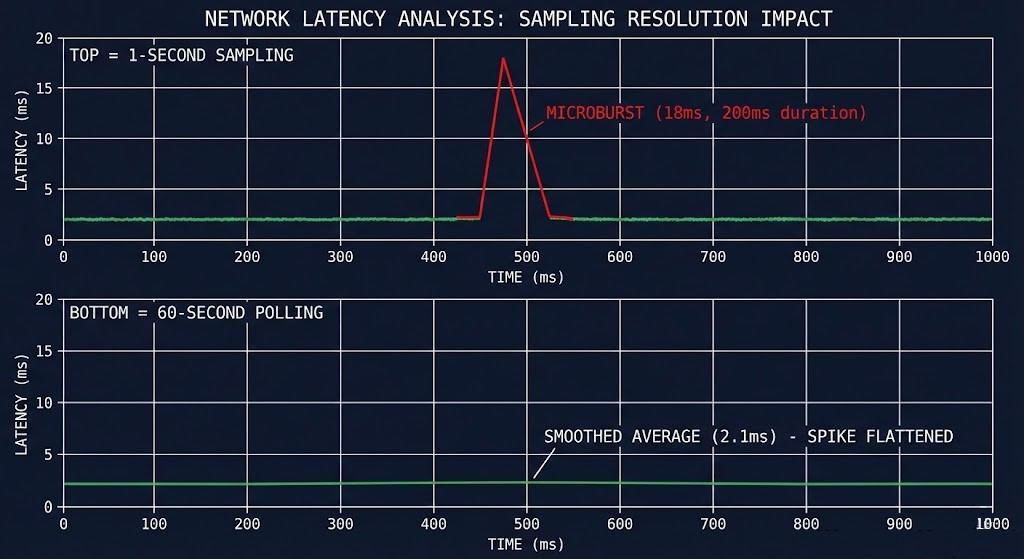
A microburst is a sudden, short-duration spike in network traffic that overwhelms switch buffers faster than congestion management can respond. They are typically 50-500 milliseconds in duration — short enough to be invisible in most monitoring systems that sample every 30-60 seconds, but long enough to cause catastrophic consequences for synchronous storage replication.
In a Metro cluster context, microbursts emerge from several common infrastructure events:
- ✕VM live migration waves — migrating multiple VMs simultaneously floods the replication link with memory copy traffic
- ✕Storage rebuild events — node failure triggers aggressive re-protection traffic across the Metro link simultaneously with normal I/O
- ✕Backup job initiation — snapshot-based backup jobs create sudden large sequential reads that compete with synchronous replication
- ✕All-reduce operations in AI clusters — GPU training synchronization creates simultaneous all-to-all traffic patterns that saturate inter-site links
- ✕Scheduled batch processing — end-of-day reporting jobs, database consistency checks, or index rebuilds that coincide with peak replication demand
The reason microbursts are invisible to most monitoring tools is a sampling problem. If your network monitoring polls every 60 seconds and a microburst lasts 200ms, the burst is averaged into the surrounding quiet traffic. The metric never shows the spike. The cluster felt it. The monitoring didn’t record it.
The only reliable way to detect microbursts is with sub-second sampling intervals and synthetic load that mimics replication traffic patterns. Testing must simulate concurrent rebuild traffic, VM migration, and application I/O simultaneously — not sequentially at idle.
Infrastructure drift compounds the microburst problem in a specific way: when QoS policies are manually overridden at the switch level and never reconciled back to IaC, replication traffic loses its priority classification silently. The next microburst hits an unprotected queue. The Infrastructure Drift Detection Guide covers the IaC governance framework that prevents this class of silent misconfiguration.
Metro Cluster Envelope: What the 5ms Threshold Actually Means
Nutanix Metro Availability specifies a 5ms RTT threshold between sites. VMware vSAN Stretched Cluster specifies 5ms for standard configurations, with some workloads requiring sub-1ms. Most other HCI Metro implementations fall in the 5-10ms range depending on replication mode.
But “5ms RTT” is not the full picture. Understanding what that threshold actually represents requires understanding the Metro write path.
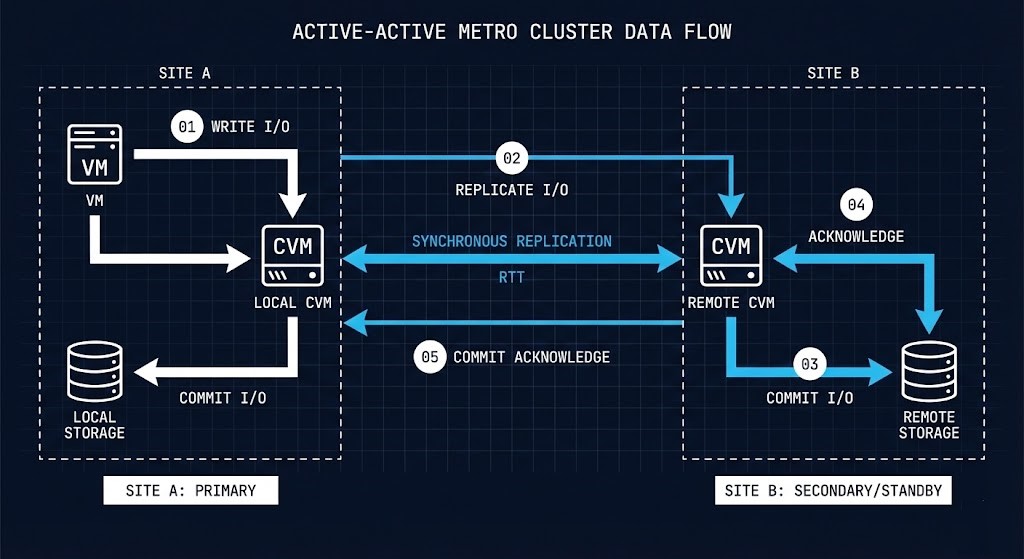
When a VM writes data in a Metro configuration, the following sequence occurs:
Every millisecond of cross-site latency adds directly to application write latency.
This means the 5ms RTT threshold isn’t a soft guideline — it’s a hard ceiling on the additional write latency your applications absorb on every synchronous write operation. A database performing 10,000 writes per second on a 4ms RTT Metro link absorbs 40 seconds of additional cumulative latency per second of operation. That math compounds quickly under transaction-heavy workloads.
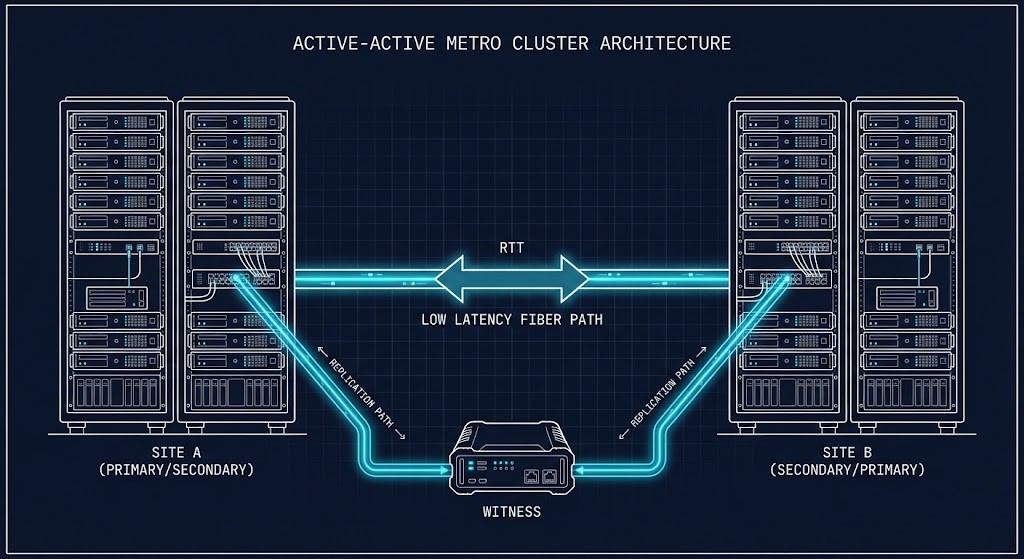
For Nutanix Metro specifically, exceeding the RTT threshold triggers witness node arbitration. The witness — a lightweight VM deployed at a third location — determines which site retains authoritative access. The other site enters a read-only or disconnected state until the link recovers. This is correct behavior. But it means your RPO and RTO assumptions during Metro link degradation must account for the arbitration window, not just the link recovery time.
VMware vSAN Stretched Cluster handles this differently — using a preferred site designation and witness host quorum rather than a symmetric arbitration model. The failure behavior is similar in outcome but different in how it transitions. If you are evaluating both platforms for Metro workloads, that distinction matters significantly for your RTO architecture. The full platform comparison is in Nutanix vs VMware: Availability vs Authority in the Post-Broadcom Datacenter.
For sovereign and disconnected environments where the witness node itself may be unreachable during a network partition, the arbitration model introduces a dependency that many air-gap architects overlook. The Sovereign Infrastructure Strategy Guide covers control plane autonomy for environments where external witness reachability cannot be guaranteed.
Variance Modeling: Engineering the Margin
The difference between an architect and an administrator is how they handle uncertainty. An administrator monitors for when things go wrong. An architect models the conditions under which things will go wrong before they happen.
For Metro deployments, variance modeling means answering one question: what does my latency envelope look like at the worst possible moment, and does it still clear the threshold?
The formula is straightforward:
Worst-Case Latency Envelope = Baseline RTT + (Jitter Standard Deviation × Burst Coefficient)Example:
Baseline RTT: 2.0ms
Jitter std deviation: 0.8ms
Burst coefficient (3σ): ×3
─────────────────────────────────
Worst-case envelope: 2.0 + (0.8 × 3) = 4.4ms
Threshold: 5.0ms
Available margin: 0.6ms ← dangerously thin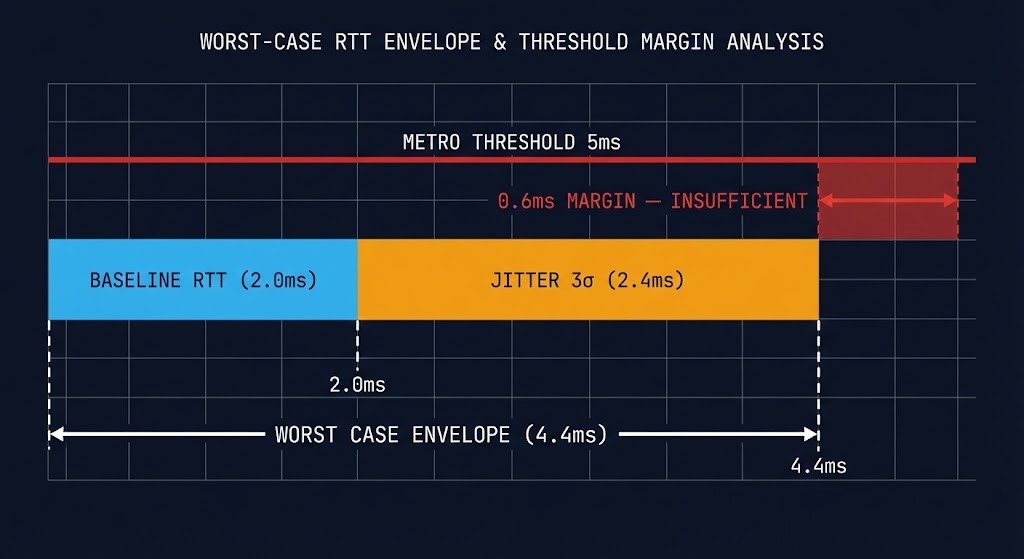
A 0.6ms margin looks adequate on paper. Under a simultaneous rebuild event and live migration wave, it is not. The burst coefficient of 3 (three standard deviations) covers 99.7% of normal variance. It does not cover the correlated burst events that occur during infrastructure stress — when multiple traffic sources spike simultaneously.
The practical recommendation: your worst-case envelope should clear the Metro threshold with at least 30% headroom under simulated stress conditions, not just baseline measurements.
For the IaC framework that encodes these margin requirements as enforceable policy — preventing future changes from eroding the headroom you modeled today — see the Modern Infrastructure & IaC Learning Path.
Deterministic Pre-Flight Framework: Metro Edition
Before enabling Metro on any cluster, run this Go/No-Go validation sequence. Use the Metro Latency Scout to run RTT variance measurements under synthetic load, or execute manually using the sequence below.
All tests must be run under concurrent load — not at idle. Idle measurements are meaningless for Metro qualification.
- Baseline RTT under load: Is the cross-site RTT below 3.5ms (Nutanix) or your platform’s threshold minus 30% headroom, while running synthetic replication-pattern traffic at 70% link utilization?
- Jitter variance test: Does P99.9 latency stay below threshold over a 15-minute test window with concurrent I/O? Sample at 100ms intervals minimum — not per-second averages.
- Packet loss floor: Is packet loss 0% during the load test? Even 0.01% sustained packet loss disqualifies the link for synchronous replication without TCP optimization.
- Burst event simulation: Does the link maintain threshold compliance during a simulated rebuild event (saturate 40% of bandwidth with sequential large-block I/O simultaneously with the latency test)?
- Witness node reachability: Is the witness reachable from both sites independently? Test site isolation by simulating cross-site link failure — confirm witness arbitration completes within your RTO window.
- QoS validation: Is replication traffic correctly classified and prioritized over backup, management, and VM migration traffic? Confirm via traffic shaping policy review, not assumption.
Run RTT variance measurements under synthetic load and validate your Metro pre-flight checklist before enabling synchronous replication. The Metro Latency Scout surfaces P99.9 envelopes, microburst events, and jitter variance that standard monitoring misses entirely.
→ Run Metro Pre-Flight ValidationArchitect’s Verdict
Metro clusters don’t fail because the RTT was too high. They fail because the RTT was measured wrong, at the wrong time, under the wrong conditions.
The physics of disconnected cloud are unforgiving. Synchronous replication means every cross-site write carries the latency tax of the worst network moment, not the average one. Model for variance. Validate under load. Build in margin — not hope.
Your Metro cluster will face a rebuild event during peak hours eventually. The only question is whether you modeled for it before, or discovered it during.
For the complete migration architecture context — how CVM resource contention interacts with Metro replication overhead during a live migration wave — the next post in the series is The Controller Tax: Modeling Hyperconverged Resource Contention.
Skip the Wait. Get the Full Playbook.
The complete Deterministic Migration Playbook includes the Nutanix Metro Cluster Implementation Checklist — hardware requirements, network topology, AOS configuration steps, and the full Go/No-Go pre-flight sequence. Delivered via The Dispatch.
↓ Download the Deterministic Migration PlaybookAdditional Resources
Editorial Integrity & Security Protocol
This technical deep-dive adheres to the Rack2Cloud Deterministic Integrity Standard. All benchmarks and security audits are derived from zero-trust validation protocols within our isolated lab environments. No vendor influence.
R.M.
Senior Solutions Architect with 25+ years of experience in HCI, cloud strategy, and data resilience. As the lead behind Rack2Cloud, I focus on lab-verified guidance for complex enterprise transitions. View Credentials →
Get the Playbooks Vendors Won’t Publish
Field-tested blueprints for migration, HCI, sovereign infrastructure, and AI architecture. Real failure-mode analysis. No marketing filler. Delivered weekly.
Select your infrastructure paths. Receive field-tested blueprints direct to your inbox.
- > Virtualization & Migration Physics
- > Cloud Strategy & Egress Math
- > Data Protection & RTO Reality
- > AI Infrastructure & GPU Fabric
Zero spam. Includes The Dispatch weekly drop.
Need Architectural Guidance?
Unbiased infrastructure audit for your migration, cloud strategy, or HCI transition.
>_ Request Triage Session