Performance Modeling the VMware Evacuation: Nutanix AHV vs Proxmox Ceph Storage I/O Reality
Why your Broadcom exit will fail if you treat storage I/O like a commodity.
The market’s no longer freaking out about the Broadcom acquisition. Panic’s over. Now it’s all about execution.
Just look at Stanford IT. They pulled off a huge 60-node migration from VMware to Proxmox, and Nutanix migrations are breaking records too. But here’s the problem: as more enterprise teams rush to leave VMware, a lot of engineers are treating hypervisor migrations like they’re just swapping out one server for another. That’s risky.
Here’s the ugly truth: in most VMware setups, storage latency sits comfortably under 1–3 milliseconds, thanks to dedicated SAN fabrics. Move those same workloads onto a distributed storage network that isn’t properly planned, and suddenly you’re adding 8–20 milliseconds per write. For a database doing 10,000 writes a second, that’s a disaster.
Sure, you can swap ESXi for KVM in a weekend if you want. But if you just try to lift-and-shift workloads from a centralized Fibre Channel SAN onto some new hyperconverged infrastructure—without rethinking your I/O—you’ll run into trouble fast.
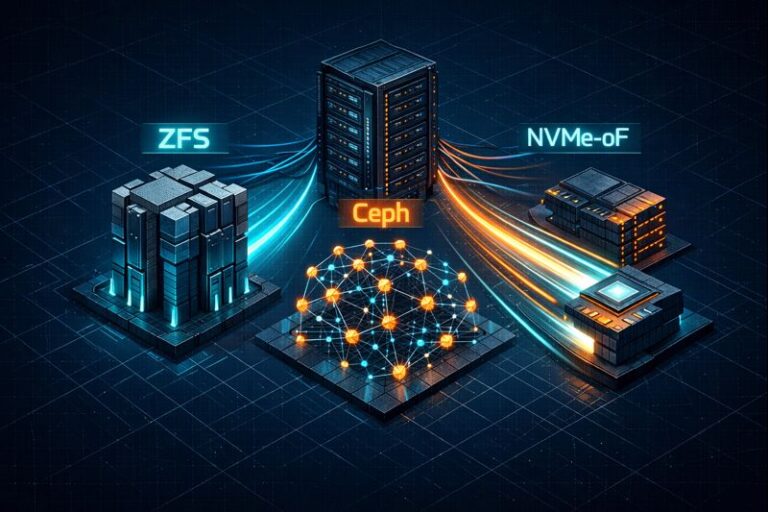
So, here’s the Rack2Cloud playbook for modeling storage performance during your VMware exit. We’re going to pit the two big architectures, Nutanix AOS and Proxmox Ceph, against each other and get real about what happens under the hood.
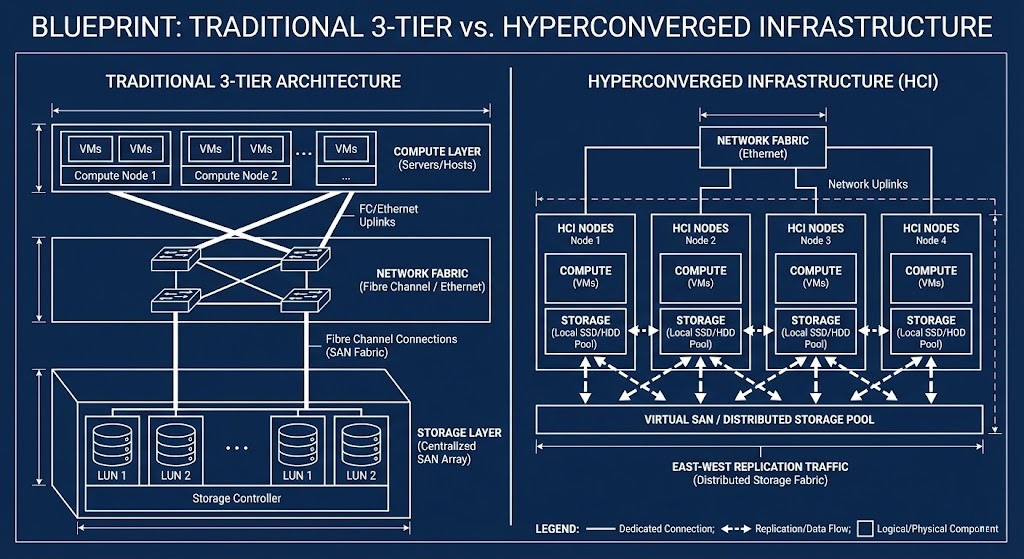
Let’s Talk HCI: East-West is Your New Backplane
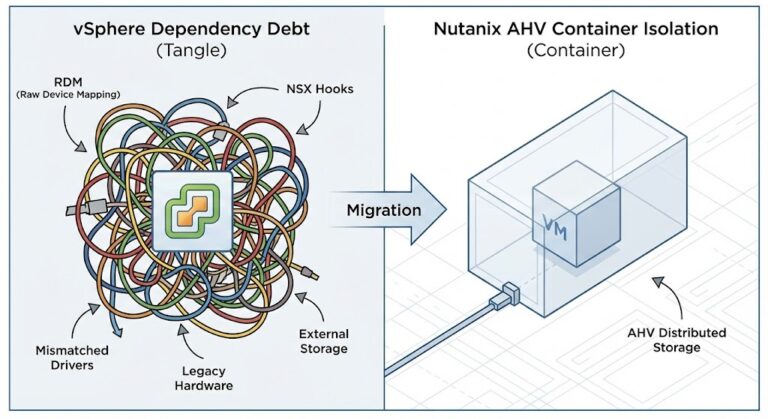
In the old 3-tier world, compute and storage lived apart. A VM asked for data, and the hypervisor sent the I/O down a dedicated Fibre Channel or iSCSI path to some giant, centralized storage controller.
But HCI changes the rules. The central controller’s gone. Now, storage is spread across all the servers running your VMs. Suddenly, your regular old Top-of-Rack Ethernet switches are hauling storage traffic. If you ignore that, network contention will take down your apps.
How Do You Model Distributed I/O?
When you leave a centralized SAN, you have to account for the network cost of replication. Here’s a simple way to figure that out:
- Effective IOPS = Workload IOPS × Replication Factor
- Effective Network Throughput = (Write IOPS × Block Size × Replicas)
Let’s take a real example. Say your database pushes 20,000 IOPS, each at 8KB, and you’ve got 3x replication in your cluster:
20,000 × 8KB × 3 = about 480 MB/s of backend network traffic.
And that’s just the baseline write traffic. You haven’t even added in rebuilds, cluster rebalancing, or node recovery storms yet.
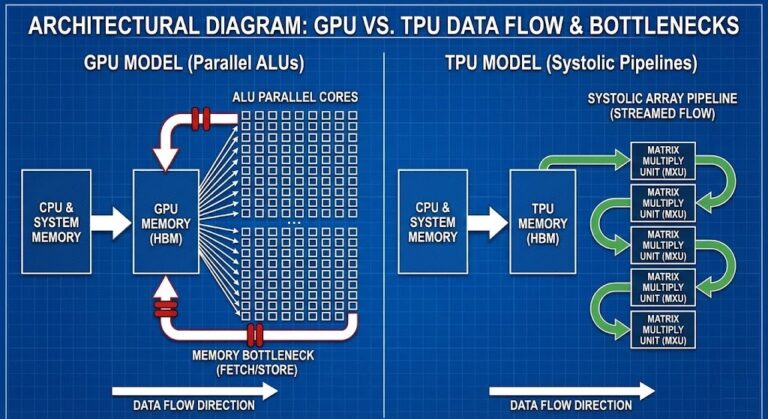
Nutanix AHV: Data Locality Wins for Reads
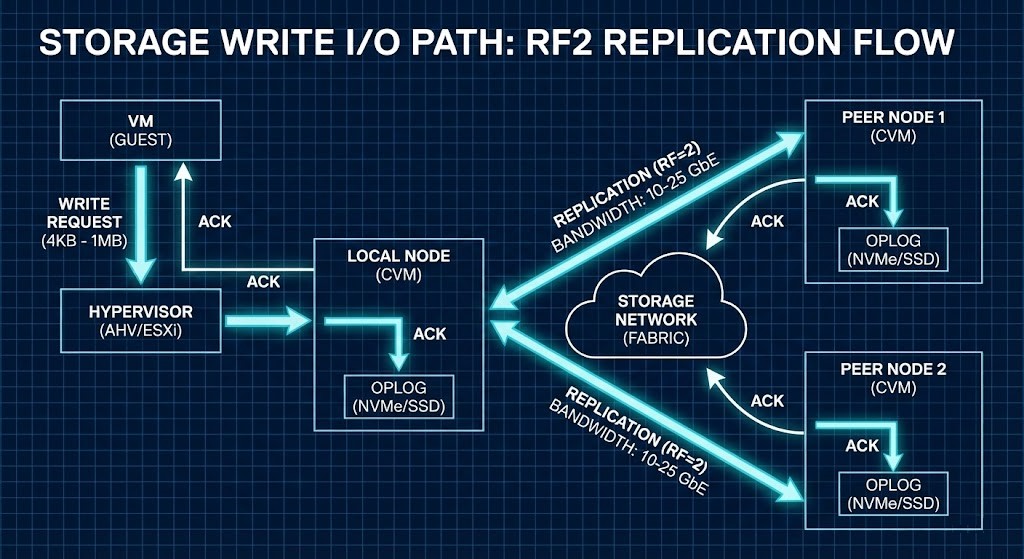
Nutanix keeps reads fast by sticking data close to the compute. Each node has a Controller VM (CVM) acting like a local storage controller.
Here’s how it works:
- Write Path: Oplog → Local disk → Network Replication
- Read Path: Always local (unless the VM just moved)
The big advantage? The data your VM needs is already on the same physical server, so reads stay off the network. That’s huge for big, monolithic databases where network hops slow things down. Just remember: you need to reserve CPU and RAM for that CVM. (We’ve got a deep-dive on sizing CVM resources and CPU wait physics if you want to get into the weeds.)
Proxmox Ceph: CRUSH and Network Everything
Proxmox comes with Ceph Storage built-in. Ceph doesn’t care about where your data is—it treats the network as the entire storage fabric. Using the CRUSH algorithm, Ceph splits data into blocks and spreads them evenly across all nodes. No hotspots.
But here’s the catch: Ceph ignores data locality, so every read and write travels over the network. When something fails and Ceph starts recovering, the recovery traffic fights with your production traffic. One node rebuild can swamp your east-west network links if you don’t have strict QoS controls.
Checklist: Can Your Network Handle East-West Storage?
This is where a lot of Broadcom exits go wrong. Before you migrate, check your setup:
- What’s your peak write IOPS?
- What replication factor are you using?
- What’s your rebuild bandwidth limit?
- How big are your switch buffers?
- Are you isolating Ceph replication traffic from VM traffic?
- Have you planned for the network hit during a node recovery storm?
Warning: If your Top-of-Rack switch buffers can’t absorb microbursts during replication, you’ll see dropped packets and latency spikes before your average utilization even looks high.
The Real Migration Trap: Bad Benchmarks
Here’s a mistake I see all the time. Engineers spin up a PoC cluster, run fio, see big throughput numbers, and think the migration’s a slam dunk.
- Synthetic benchmarks are not transactional workloads.
- Sequential I/O is not the same as small block random writes.
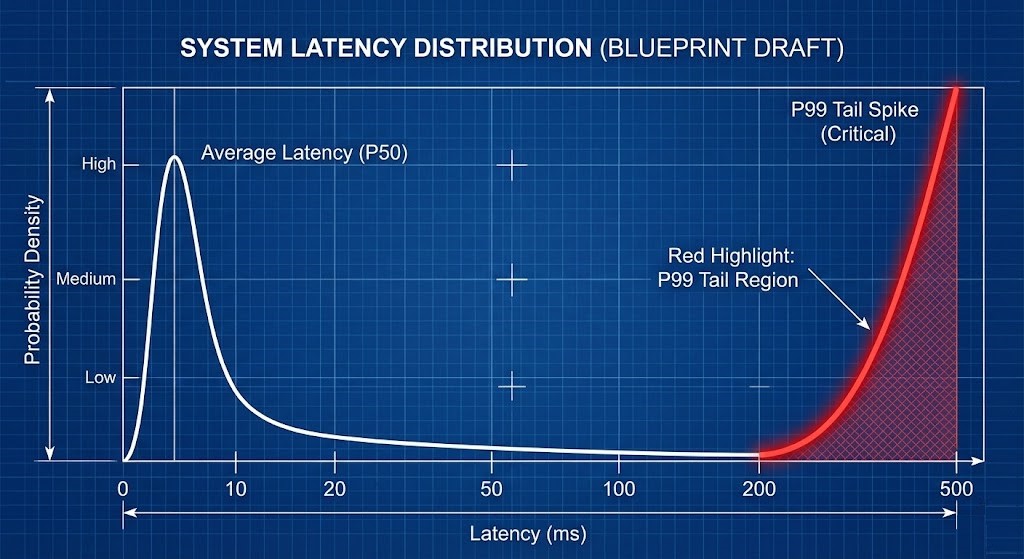
- Average latency means nothing if your p99 latency is through the roof.
Distributed storage does not fail at the average; it fails at the p99 tail. If 99% of your I/O is sub-millisecond, but 1% takes 40ms because of a microburst dropping a packet in the switch buffer, a latency-sensitive database will stall.
The Rack2Cloud Performance Decision Matrix
Map your application dependency chains against these storage realities before signing a replacement PO.
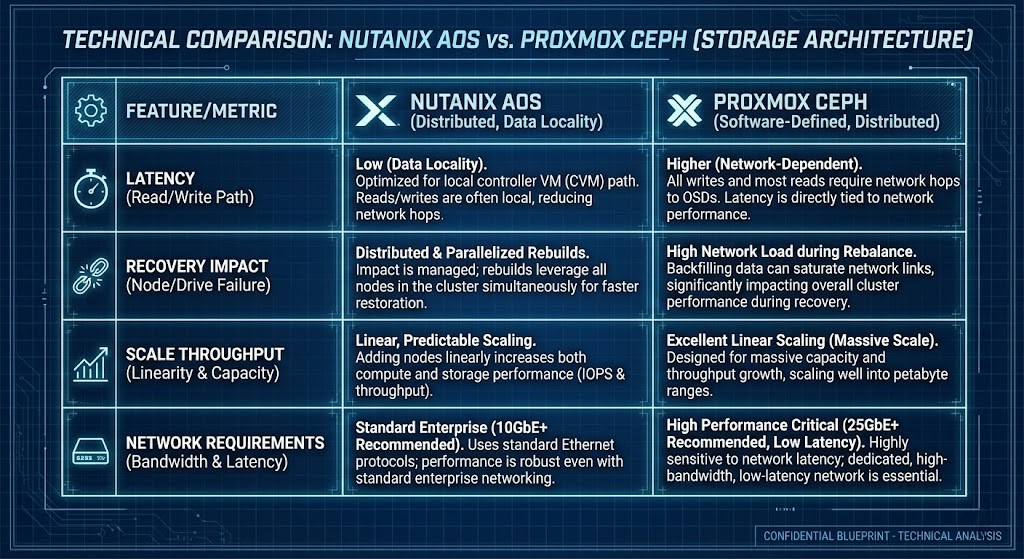
- Write Amplification: Lean Nutanix for moderate overhead. Lean Proxmox for high, network-bound environments.
- Failure Recovery Impact: Nutanix handles it locally. Proxmox recovery is network-wide.
- Latency Sensitivity: Nutanix is excellent for Monolithic DBs. Proxmox carries high risk without RDMA/RoCE.
- Scale-Out Throughput: Nutanix is good. Proxmox is exceptional.
- Network Requirements: Nutanix needs moderate (10/25GbE). Proxmox needs aggressive (25/100GbE minimum).
Q: How do you model distributed storage I/O?
A: It is basic math with a hidden trap. First, multiply your write IOPS by your replication factor. Then convert that to bandwidth: Write IOPS × Block Size × Replicas = Backend Network Load. But here is the trap: that only gives you your steady-state traffic. You must add massive headroom for rebuilds and cluster rebalancing. Always model your failure-state traffic, not just your baseline.
Q: Is 10GbE enough for Proxmox Ceph?
A: If you are running a homelab or very light workloads? Maybe. For a production database with 3x replication? Absolutely not. 25GbE is the practical baseline for Ceph to survive a node rebuild without choking your VMs. 100GbE is the standard for dense, high-write enterprise environments.
Q: Why does p99 latency matter more than average latency in HCI?
A: Because databases do not stall at the average—they stall at the slowest writes. You can look at a dashboard showing 1ms average latency and still be getting hit with 40ms microburst spikes. That 1% tail is what breaks transactional workloads. Distributed storage fails at the tail, not the mean.
Expand the Model
This article focuses specifically on distributed storage I/O. But performance collapse is rarely isolated.
To model the full system — CPU scheduling fairness, network microbursts, NUMA rebinding, and tail-latency amplification — continue through the complete Performance Modeling Learning Path.
Storage is only one interaction surface. Collapse happens at the coupling points.
Initialize Your Exit Strategy
Treating a virtualization migration as a simple UI swap is the ultimate Day 2 trap. If you cannot diagram your write path, replication path, and failure-recovery bandwidth before signing your replacement PO, you are gambling with production.
- Secure the Architecture: Review the Virtualization Architecture Learning Path for our complete, risk-deterministic migration framework.
- Review the Specs: Access our open-source Broadcom Exit Strategy Canonical Specifications for raw SE whiteboard artifacts.
- Mind the Egress: If your VMware exit involves moving workloads to the public cloud instead of an alternative hypervisor, ensure you model the data transit costs using our Cloud Egress Cost Patterns.
R.M.
Senior Solutions Architect with 25+ years of experience in HCI, cloud strategy, and data resilience. As the lead behind Rack2Cloud, I focus on lab-verified guidance for complex enterprise transitions. View Credentials →
Editorial Integrity & Security Protocol
This technical deep-dive adheres to the Rack2Cloud Deterministic Integrity Standard. All benchmarks and security audits are derived from zero-trust validation protocols within our isolated lab environments. No vendor influence.
This architectural deep-dive contains affiliate links to hardware and software tools validated in our lab. If you make a purchase through these links, we may earn a commission at no additional cost to you. This support allows us to maintain our independent testing environment and continue producing ad-free strategic research. See our Full Policy.