The vCenter Control Plane: Optimization, Sizing, and the “Hidden” Java Tax
vCenter performance optimization is consistently under-engineered — not because the fixes are complex, but because most teams don’t understand what they’re actually tuning.
Most engineers treat the vCenter Server Appliance (VCSA) like a utility — a simple management console that just needs to “be there.” They deploy it using the “Tiny” preset, snapshot it once a month, and then complain when the HTML5 interface takes eight seconds to load or the API times out during a Terraform apply.
This is a fundamental misunderstanding of the architecture.
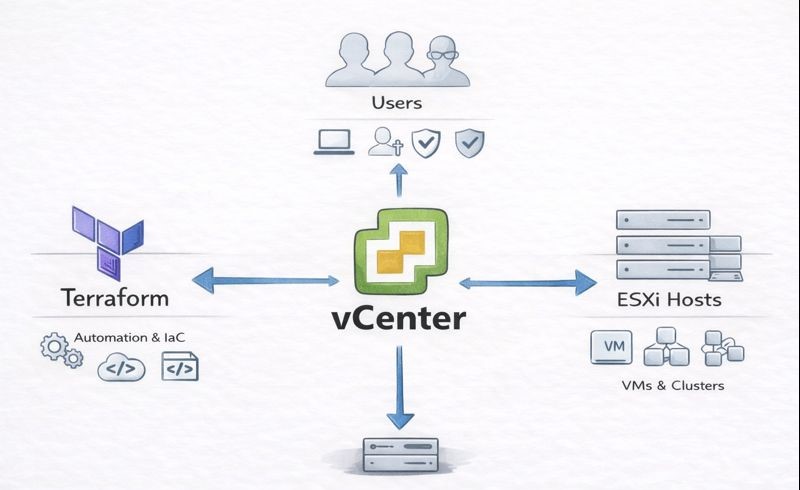
VCSA is not an operating system. It is a complex, multi-tiered application stack — a PostgreSQL database wrapped in a heavy Java blanket, managing hundreds of concurrent API sessions. If you treat it like a static VM, you are starving your infrastructure’s brain.
In the era of Infrastructure as Code, vCenter is no longer just a UI. It is a critical API endpoint. If the endpoint lags, your automation fails. This is the same control plane fragility that governs the broader Virtualization Architecture decision — and it is exactly why the Broadcom Year Two renewal calculation must include operational overhead, not just licensing cost.
Here is the forensic guide to tuning the control plane.
vCenter Performance Optimization: The Sizing Trap
When deploying VCSA, the installer asks you to pick a size: Tiny, Small, Medium, Large, or X-Large. The description for “Tiny” says it supports up to 10 hosts and 100 VMs.
Architect’s Rule: “Tiny” is for home labs. Never use it in production.
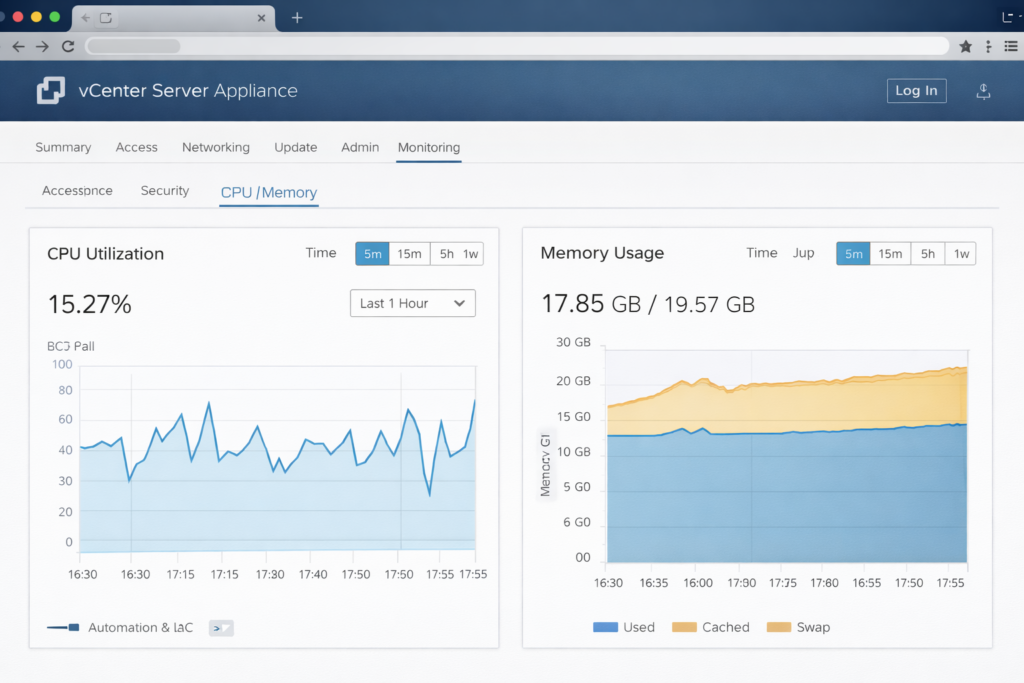
The issue isn’t CPU contention — it’s memory architecture. VCSA runs heavily on Java. When the appliance boots, the Java Virtual Machine pre-allocates a specific chunk of RAM called the Heap based on the deployment size selected at install time.
| Size | vCPU | RAM | JVM Behavior |
|---|---|---|---|
| Tiny | 2 | 12 GB | Heap starves under load |
| Small | 4 | 19 GB | Minimum viable production |
| Medium | 8 | 28 GB | Enterprise baseline |
| Large | 16 | 37 GB | High automation density |
| X-Large | 24 | 56 GB | Massive environments |
The “Just Add RAM” Myth
Many engineers deploy a Tiny node (12GB RAM) and later bump the VM settings to 24GB, thinking they’ve upgraded performance. They haven’t. Unless you manually edit the service config files or run a specific CLI sizing command, the JVM doesn’t know the extra RAM exists. It will continue running with the constrained Tiny heap size — ignoring every gigabyte of capacity you gave the VM.
Recommendation: Always start with Small (4 vCPU / 19GB RAM) for any cluster running production backup tools (Veeam, Rubrik) or monitoring agents. The overhead cost of 7GB of RAM is cheaper than the downtime of a crashed vpxd service. The storage and backup implications of that vpxd crash are covered in the Immutable Backups 101 guide — specifically the section on what happens when the backup software loses its management endpoint mid-job.
Database Mechanics: The Performance Killer
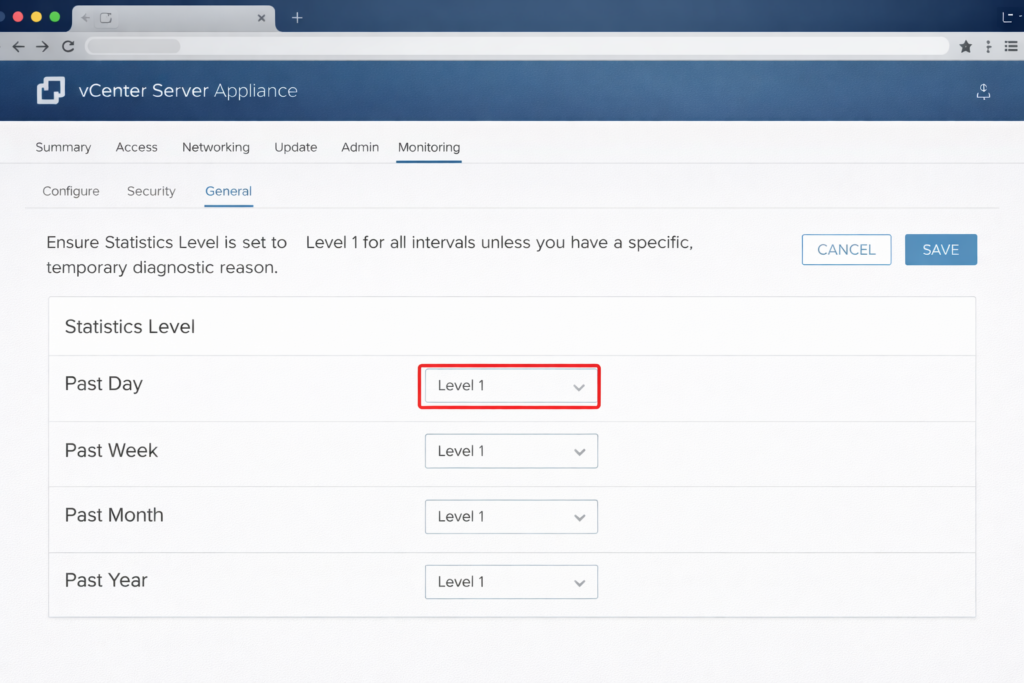
The number one vCenter performance optimization win costs nothing — fix Statistics Logging.
VMware allows granular metric tracking across past day, week, month, and year intervals. By default this is Level 1. The trap: troubleshooting leads engineers to crank this to Level 3 or 4 to “see more data.” They fix the issue and forget to revert.
The result: The internal Postgres database explodes in size. The I/O subsystem is hammered writing millions of metric rows per hour, and the web interface — which reads from that same database — locks up. Your monitoring tool created the problem it was trying to diagnose.
Action Item: Check your settings immediately:
Configure → Settings → General → DatabaseEnsure Statistics Level is set to Level 1 for all intervals unless you have a specific, temporary diagnostic reason. If you need deep historical metrics, offload that responsibility to a dedicated monitoring tool. Do not use your control plane as a data warehouse.
This is the same principle that governs infrastructure drift detection — your observability tooling should never create operational risk in the systems it monitors. See the Infrastructure Drift Detection Guide for how to instrument vCenter API health as part of a broader IaC observability stack.
The Shim Tax: Plugin Hygiene
Plugin hygiene is the most overlooked vCenter performance optimization that senior engineers miss. Every vendor wants real estate in your vCenter UI. When you log in, vCenter loads UI extensions for your storage array, backup software, hardware vendor, and that legacy tool you uninstalled three years ago but whose plugin definition is still registered.
Uninstalling a tool often leaves the plugin definition behind. vCenter still tries to load it, waits for a timeout, and effectively hangs your login process. Eight-second login times are almost always a plugin hygiene problem before they are a sizing problem.
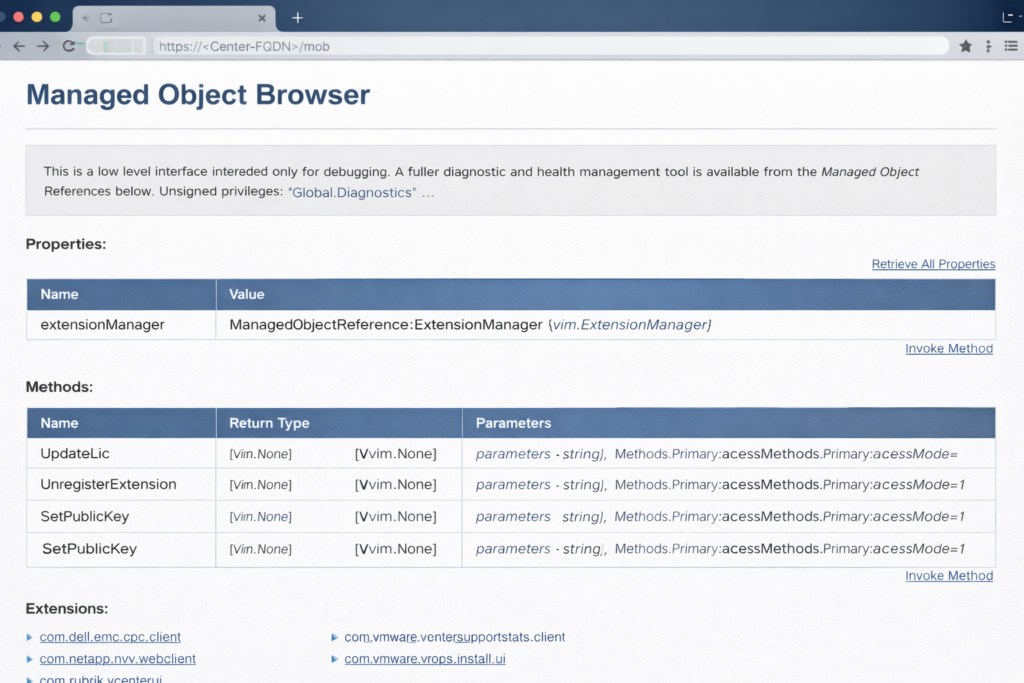
The Fix: The MOB
Clean orphaned plugins manually using the Managed Object Browser:
- Navigate to
https://<vcenter-fqdn>/mob - Click Content → ExtensionManager
- Look for extensions with names like
com.dell.pluginorcom.netapp.pluginrepresenting tools you no longer use - Use the UnregisterExtension method to remove them surgically
Warning: The MOB is powerful. Deleting the wrong extension can break vCenter. Audit the list carefully and cross-reference against your active vendor tools before removing anything.
Backup Strategy: Image vs File-Based
Stop relying on VM snapshots as your primary vCenter backup strategy.
If your vCenter crashes due to database corruption — the most common failure scenario — restoring a snapshot restores the corrupted database. You are back to square one with a clean-looking VM running broken data.
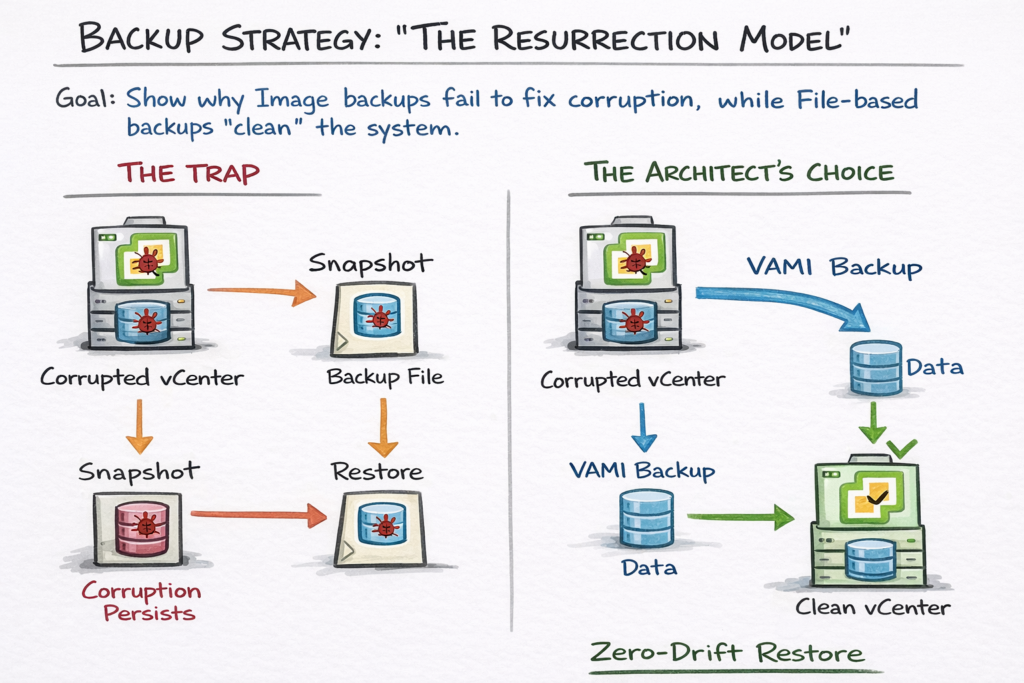
The Solution: Native File-Based Backup
Use the VAMI (Port 5480) backup scheduler. This does not back up the VM — it backs up the configuration and the data separately.
When you restore from a file-based backup, the installer spins up a brand new, clean appliance and imports your data into it. This eliminates OS drift, filesystem corruption, and accumulated junk in the underlying Photon OS — the three failure modes that snapshot restores preserve rather than fix.
Lab Recommendation: Configure a daily native backup to an NFS or SMB share. For environments where the vCenter backup feeds into a broader data protection strategy, model your recovery time and storage requirements using the Cloud Restore Calculator — particularly if your backup target is cloud-hosted object storage.
Connection Limits & The API Storm
In modern environments, humans aren’t the only ones logging into vCenter. Terraform, Ansible, Jenkins, and monitoring scripts are constantly hitting the API. VCSA has hard limits on concurrent sessions per user — and a poorly written script that opens a new session for every single query will trigger an API Storm.
Symptom: Random 503 Service Unavailable errors during automation runs.
Cause: The vpxd service is exhausted handling authentication handshakes instead of serving API reques
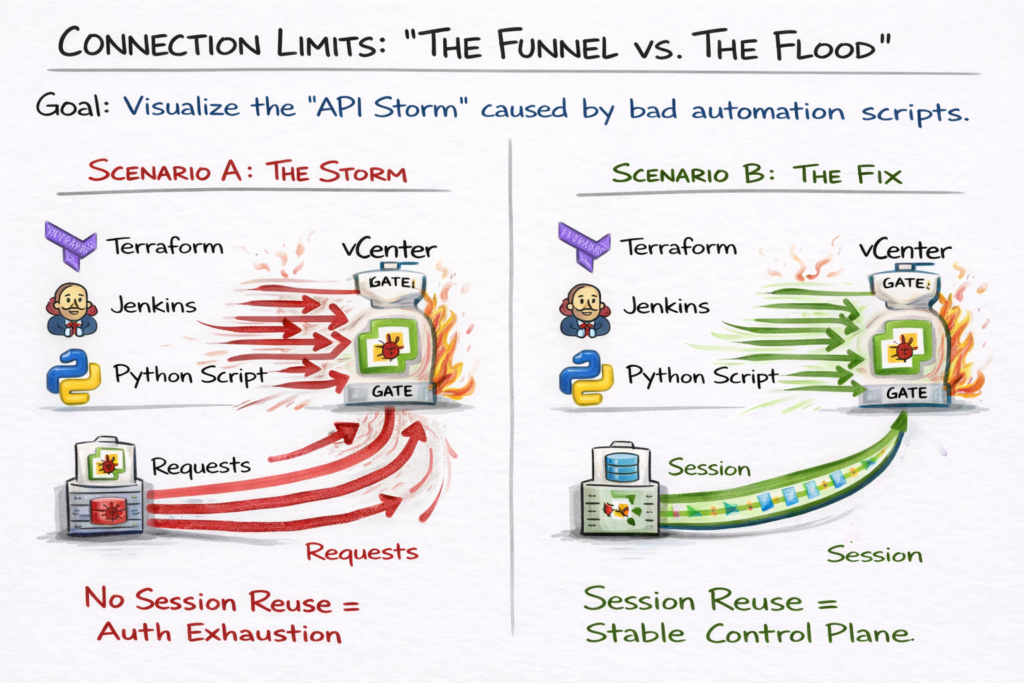
Optimization Strategy:
- Service Accounts: Never run automation scripts as
[email protected]. Create dedicated service accounts with scoped permissions for each automation tool - Session Reuse: Ensure Python, Go, and Terraform scripts reuse the Session ID rather than opening a new authenticated session per API call
- Log Monitoring: Review
/var/log/vmware/vpxd/vpxd.logfor “Session limit exceeded” warnings — these appear well before the 503s become user-visible
For teams managing vCenter via Terraform or OpenTofu, provider version mismatches between the vSphere provider and the VCSA API version are a common source of session instability that presents as API timeouts. The Terraform Feature Lag Tracker surfaces delays between vSphere API releases and Terraform provider support — preventing the “provider doesn’t support this yet” surprise that manifests as authentication loops during automation runs. For a structured IaC governance framework covering session management and pipeline reliability, see the Modern Infrastructure & IaC Learning Path.
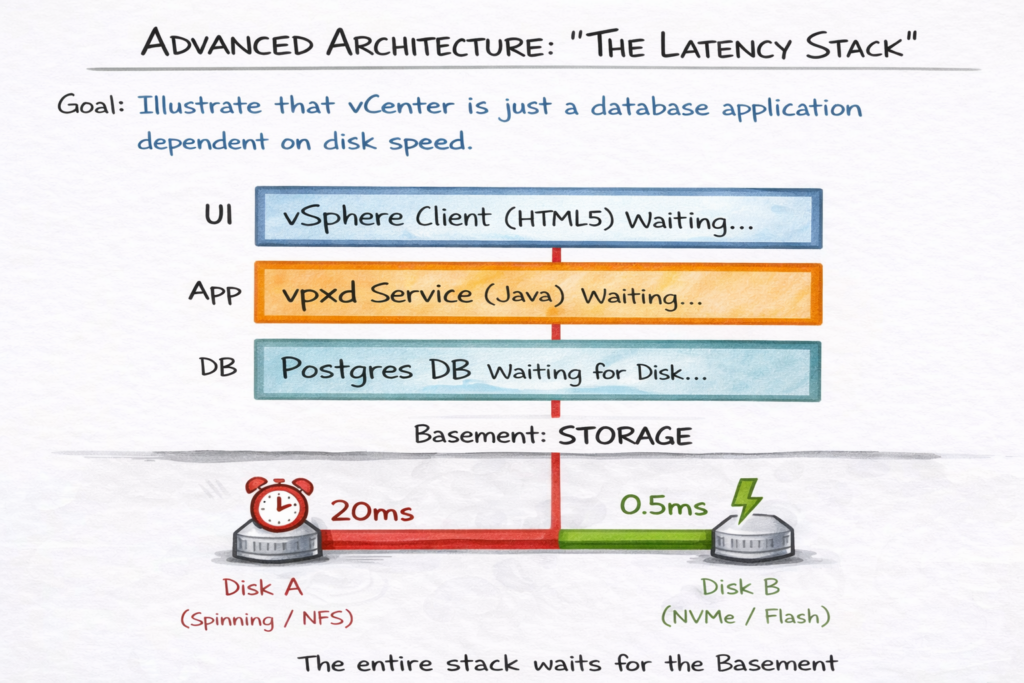
Advanced Architectures: Latency & Availability
Disk Tiering: Why Latency Beats CPU
vCenter performance scales far more aggressively with storage latency than with CPU cycles. The Postgres database is transactional — if it waits 10ms for a write confirmation, your entire UI waits. CPU cycles are rarely the bottleneck. Storage I/O almost always is.
Best Practice: Place the /storage/db partition on your lowest-latency datastore. If running on vSAN, assign a specific Storage Policy to the VCSA that guarantees flash read cache or NVMe tiering. Avoid placing the VCSA database on generic, high-latency NFS shares unless absolutely necessary.
The vCenter HA Trap
Do not confuse vCenter High Availability (VCHA) with a backup strategy. VCHA protects against host failure through active/passive node replication. VCHA does not protect against database corruption — if your primary database corrupts, that corruption replicates instantly to the passive node.
Architect’s Verdict: VCHA adds significant operational complexity — and complexity is a risk multiplier. Enable it only if your SLA specifically demands zero-downtime for the control plane API. For 99% of organizations, vSphere HA (VM restart) combined with a solid file-based restore plan is architecturally superior and operationally simpler.
Pre-Upgrade Hygiene
Most vCenter upgrades fail not because of bugs in the new code, but because of technical debt in the old appliance. Before clicking Upgrade:
- Validate DB size: If your database is bloated with Level 4 stats, the upgrade migration will timeout mid-process
- Audit plugins: Old plugins frequently break installer pre-checks — the MOB cleanup above is a mandatory pre-upgrade step
- Snapshot age: Delete any snapshots older than 72 hours. Stale snapshots degrade disk I/O performance, artificially slowing the upgrade process and sometimes causing it to fail entirely
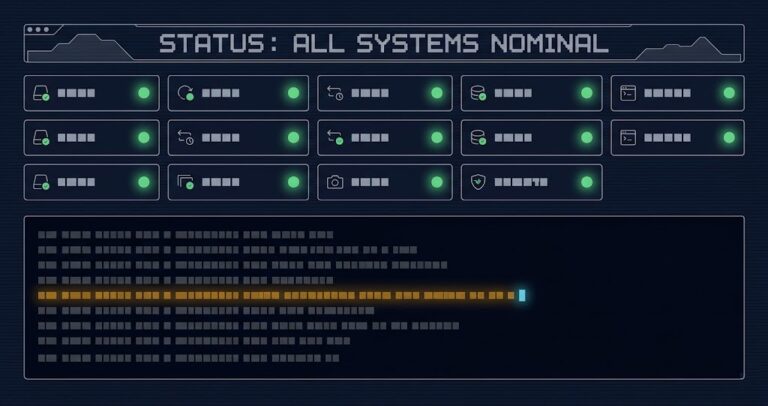
The Control Plane Health Checklist
If you can check all ten boxes, your control plane is architecturally sound:
Architect‘s Verdict: Build a Resilient Brain
vCenter performance optimization isn’t about making the UI faster for its own sake. It’s about making it resilient enough to handle the demands of a modern, automated infrastructure — where the control plane is an API endpoint serving Terraform, Ansible, and monitoring pipelines simultaneously, not just a UI for occasional manual changes.
If you are evaluating whether vCenter’s operational overhead justifies continued investment under Broadcom’s pricing model, the Broadcom Year Two Architecture Guide maps the exact TCO calculation — including control plane operational cost as a line item in the stay-vs-go decision.
For deeper dives into control plane architecture, IaC governance, and the full virtualization decision framework, see the Modern Virtualization Learning Path.
Additional Resources
Editorial Integrity & Security Protocol
This technical deep-dive adheres to the Rack2Cloud Deterministic Integrity Standard. All benchmarks and security audits are derived from zero-trust validation protocols within our isolated lab environments. No vendor influence.
R.M.
Senior Solutions Architect with 25+ years of experience in HCI, cloud strategy, and data resilience. As the lead behind Rack2Cloud, I focus on lab-verified guidance for complex enterprise transitions. View Credentials →
Get the Playbooks Vendors Won’t Publish
Field-tested blueprints for migration, HCI, sovereign infrastructure, and AI architecture. Real failure-mode analysis. No marketing filler. Delivered weekly.
Select your infrastructure paths. Receive field-tested blueprints direct to your inbox.
- > Virtualization & Migration Physics
- > Cloud Strategy & Egress Math
- > Data Protection & RTO Reality
- > AI Infrastructure & GPU Fabric
Zero spam. Includes The Dispatch weekly drop.
Need Architectural Guidance?
Unbiased infrastructure audit for your migration, cloud strategy, or HCI transition.
>_ Request Triage Session