Kubernetes Day‑2 Incidents: 5 Real‑World Failures and the One Metric That Predicts Them
Kubernetes day 2 failures are not random. The same five failure modes surface every month — and the tells are always there if you know which metrics to watch. Day 1 is shipping the cluster. Day 2 is living with it.
And Day 2 has patterns. Not bugs that are unique to your environment — patterns. The same five failure modes surface every month, across clusters of different sizes, different clouds, and different teams. They present differently each time, but they all have a tell. A single metric that, if you’re watching it, gives you a warning window before the incident becomes an outage.
This is the short version. Each incident below links to a full diagnostic deep-dive in the K8s Day 2 Method series — built from real cluster triage, not documentation theatre. If you’re building out your Day-2 operational stack more broadly, the Modern Infrastructure & IaC Learning Path covers the full engineering discipline these diagnostics sit inside.
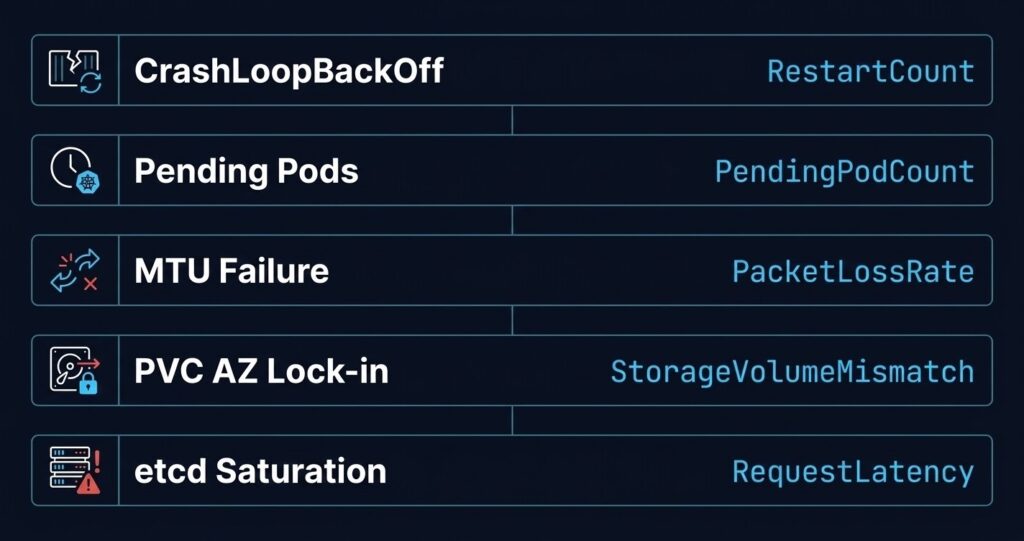
Incident 1: CrashLoopBackOff — The Most Misdiagnosed Kubernetes Day 2 Failures
What it looks like: Pod starts, fails, restarts, fails again. The loop is visible in kubectl get pods — RESTARTS column climbing. Logs are often unhelpful because the container exits too fast to write anything useful.
What engineers chase first: Application bugs, missing config maps, wrong image tag.
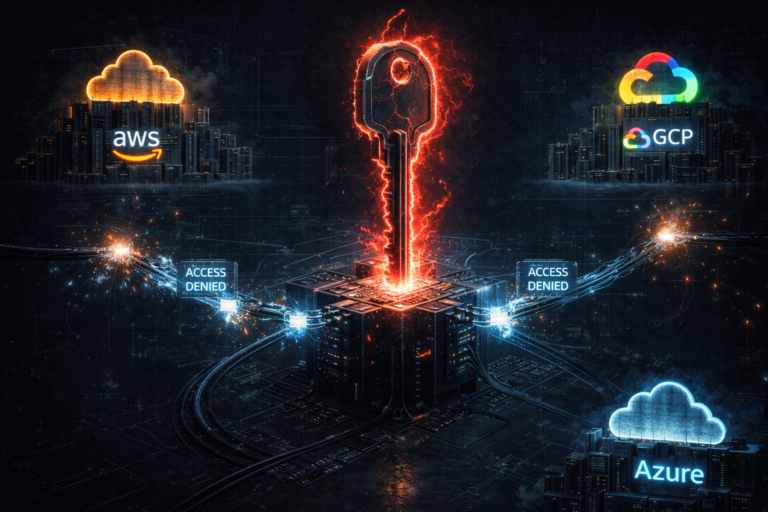
What it usually is: An IAM or credential problem. The container starts, attempts to authenticate to a registry, a secrets manager, or a downstream API — fails silently — and crashes. The Identity Loop deep-dive shows how often ImagePullBackOff and CrashLoopBackOff share the same root cause: broken identity, not broken code.
The loop: Container starts → auth call fails → exit code 1 → kubelet restarts → back to the top.
The metric to watch:
kube_pod_container_status_restarts_totalCombine with exit code from kubectl describe pod. Exit code 1 or 128+ with rapid restart cadence is the pattern. Exit code 0 with a crash loop means your readiness probe is failing — a different problem entirely.
Incident 2: Scheduler Stuck — Pending Pods That Never Resolve
What it looks like: Pods sit in Pending indefinitely. kubectl describe pod reports FailedScheduling. The cluster looks healthy from the outside — nodes are Ready, CPU and memory utilisation look fine.
What engineers chase first: Resource limits, node selectors, affinity rules.
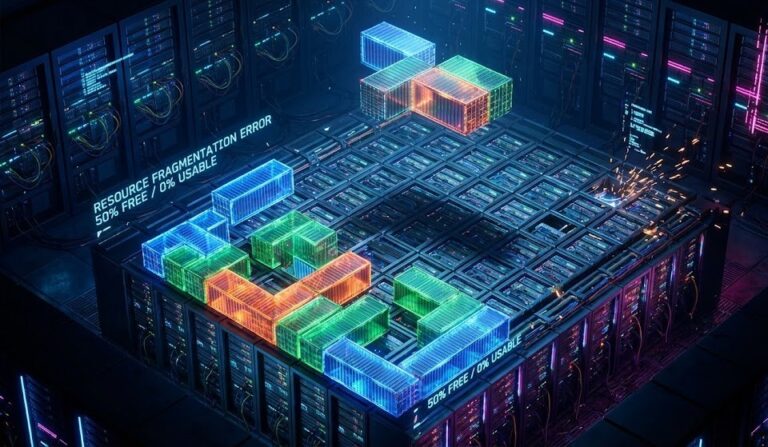
What it usually is: The gap between allocatable and requested. Every node already has pods whose resource requests consume available headroom — even if actual utilisation is 30%. The scheduler sees a cluster that looks available but can’t place the pod. The Compute Loop post covers why kubectl top nodes lies to you during this incident.
The loop: Pod scheduled → no node satisfies constraints → returns to pending → no retry escalation → stays pending forever.
The metric to watch:
kube_pod_status_phase{phase="Pending"}  — age matters, not count
kube_node_status_allocatable vs kube_pod_resource_requests_cpu_cores (sum by node)
A node showing 25% CPU utilisation with 95% of allocatable CPU requested is a stuck scheduler waiting to happen.
Incident 3: Silent Network Failures — MTU Mismatch on Overlay
What it looks like: Services work locally. Cross-node calls fail intermittently with timeouts or 502s. DNS resolution succeeds. TCP connections establish. Payloads above a certain size silently drop or fragment.
What engineers chase first: DNS. It’s always DNS until it isn’t.
What it usually is: MTU mismatch between the overlay network (VXLAN/Geneve adds overhead) and the underlying NIC or cloud virtual network. Large packets get fragmented or dropped without ICMP responses — common in cloud provider networks — so the failure is invisible at the connection layer. It’s Not DNS (It’s MTU): Debugging Kubernetes Ingress walks the full diagnostic sequence. For clusters running a service mesh, mTLS handshake failures present with an identical symptom profile to MTU failures — both surface as intermittent 502s with clean connection-layer metrics. The Service Mesh Architecture pillar covers the debugging opacity that mesh deployments add to this failure signature.
The loop: Large payload → overlay encapsulation pushes past MTU → silent drop or fragmentation → TCP retransmit storm → timeout → 502.
The metric to watch:
node_network_receive_drop_total
node_network_transmit_drop_total  — per interface, not aggregate
Drops on the overlay interface (flannel0, cilium_vxlan, geneve.1) with clean physical NIC stats is the MTU fingerprint.
Incident 4: Storage Gravity — PVC Stuck or Pod on Wrong Node
What it looks like: Pod restarts on a different node after a failure. New node can’t mount the PVC. Pod stays in ContainerCreating. Or: PVC provisioned in zone A, pod schedules to zone B, and Kubernetes can’t reconcile.
What engineers chase first: Storage class configuration, provisioner health.
What it usually is: Block storage is zonal. In AWS, Azure, and GCP, volumes are tied to a specific availability zone at provisioning time. When a pod reschedules across zones, the volume can’t follow. volumeBindingMode: WaitForFirstConsumer exists to fix this — but most default storage classes don’t use it, and the failure only surfaces under pressure (node failure, rolling upgrade), not during initial deployment.
The loop: Node fails → pod reschedules to different AZ → PVC can’t attach cross-AZ → pod stuck in ContainerCreating → manual intervention required.
The metric to watch:
kube_persistentvolumeclaim_status_phase{phase="Pending"}
kube_pod_status_phase{phase="Pending"}  — correlated with volume attach events in node logs
The smoking gun is in kubectl describe pvc — look for ProvisioningFailed or FailedMount events with AZ mismatch detail.
Incident 5: etcd / Control-Plane Saturation
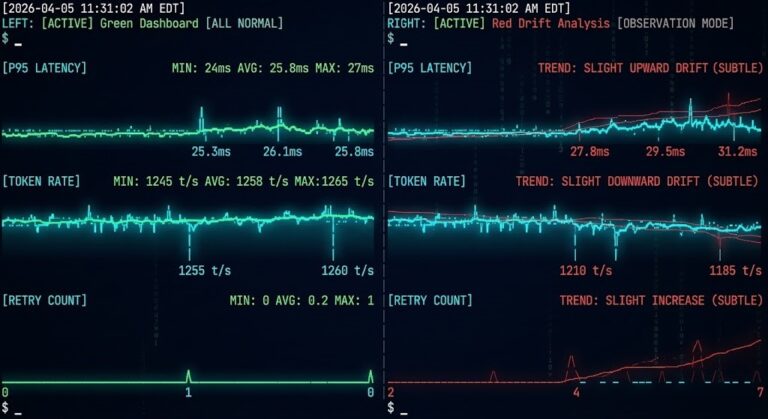
What it looks like: API server returns timeouts intermittently. kubectl commands hang. Controllers start flapping — deployments stop reconciling, HPA makes erratic scaling decisions, node status updates lag. The cluster appears healthy at the workload layer while the control plane is quietly drowning.
What engineers chase first: Application load, network issues, node problems.
What it usually is: etcd is I/O-bound. etcd uses a write-ahead log and requires consistent low-latency disk writes. On cloud VMs with shared storage, under burst conditions, etcd disk IOPS hit a ceiling. When etcd can’t commit writes fast enough, leader election latency increases, the API server starts queuing requests, and the entire control plane degrades — without any obvious workload-layer signal.
The loop: High cluster churn (many deployments, HPA events, CRD updates) → etcd write amplification → disk IOPS ceiling → etcd heartbeat latency → API server timeout cascade → controllers lose sync → more churn.
The metric to watch:
etcd_disk_wal_fsync_duration_seconds_bucket  — p99 > 10ms is a warning, > 100ms is a problem
apiserver_request_duration_seconds_bucket    — p99 latency climbing signals downstream etcd pressure
On managed Kubernetes (AKS, EKS, GKE), you won’t have direct etcd access — but API server latency is surfaced through the managed control plane. A p99 spike with no corresponding application traffic increase is a control-plane problem, not an application problem.
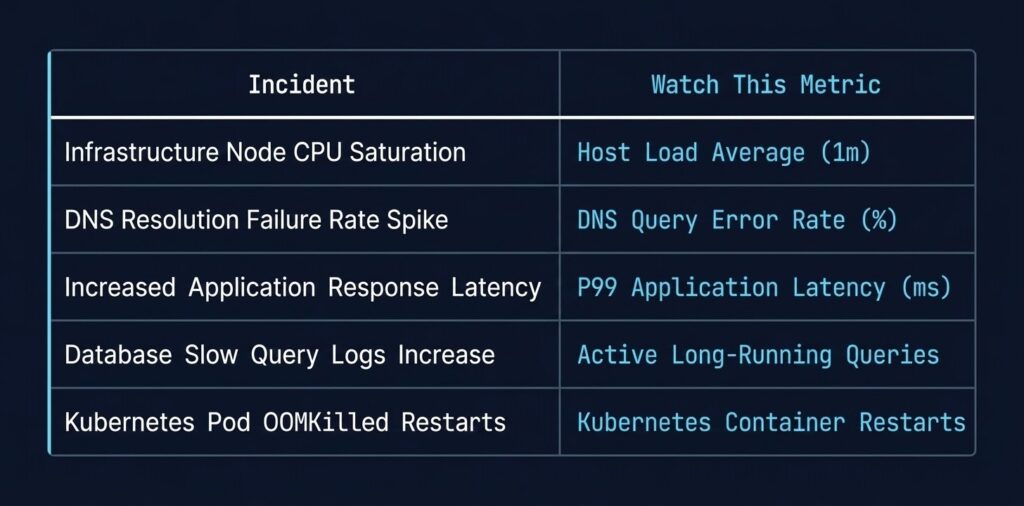
The Pattern Underneath All Five
The Pattern Underneath All Five
Each of these incidents shares a structure: the symptom layer is noisy and misleading, and the cause layer is quiet until it isn’t. CrashLoopBackOff looks like a code problem. Pending pods look like resource exhaustion. 502s look like DNS. Storage failures look like provisioner bugs. API timeouts look like network problems.
The Rack2Cloud Method for Kubernetes Day-2 Operations is built around this pattern — diagnostic loops that start at the symptom, walk the signal chain, and land on the root cause without chasing false leads. Each of the four series deep-dives covers one loop in full: identity, compute, network, and storage. For the broader platform engineering context these operational patterns sit inside, the Platform Engineering Architecture pillar covers how Day-2 operational discipline maps to the full internal developer platform stack. The scheduler and resource contention failure modes in this series — fragmentation, PDB deadlock, admission gaps — operate at the same architectural layer that governs AI workload placement and cluster authority. The Runtime & Cluster Orchestration stage of the AI Architecture Learning Path extends this failure pattern library into GPU scheduling, heterogeneous cluster coordination, and execution governance at the AI workload layer.
If you’re running Kubernetes on Azure specifically, Petro Kostiuk’s write-up on applying the Rack2Cloud method in AKS adds the managed-plane layer that changes several of these diagnostic sequences — worth reading alongside the series.
The canonical failure signatures and diagnostic protocols for all four loops are also published in the Rack2Cloud GitHub repo — open reference, no login required.
If you want the full diagnostic playbook in a single downloadable format, the Architecture Failure Playbooks page includes the K8s Day-2 Diagnostic Playbook alongside the other operational frameworks — select your paths and it ships to your inbox.
Additional Resources
Editorial Integrity & Security Protocol
This technical deep-dive adheres to the Rack2Cloud Deterministic Integrity Standard. All benchmarks and security audits are derived from zero-trust validation protocols within our isolated lab environments. No vendor influence.
R.M.
Senior Solutions Architect with 25+ years of experience in HCI, cloud strategy, and data resilience. As the lead behind Rack2Cloud, I focus on lab-verified guidance for complex enterprise transitions. View Credentials →
Get the Playbooks Vendors Won’t Publish
Field-tested blueprints for migration, HCI, sovereign infrastructure, and AI architecture. Real failure-mode analysis. No marketing filler. Delivered weekly.
Select your infrastructure paths. Receive field-tested blueprints direct to your inbox.
- > Virtualization & Migration Physics
- > Cloud Strategy & Egress Math
- > Data Protection & RTO Reality
- > AI Infrastructure & GPU Fabric
Zero spam. Includes The Dispatch weekly drop.
Need Architectural Guidance?
Unbiased infrastructure audit for your migration, cloud strategy, or HCI transition.
>_ Request Triage Session