The Repatriation Calculus: What the 93% Signal Actually Means
The 93% figure landed quietly in February 2026. Ninety-three percent of enterprises surveyed reported actively repatriating AI workloads from public cloud back to on-premises or colocation infrastructure. Not evaluating it. Not piloting it. Actively doing it.
The instinct is to read this as a cloud failure story. It is not. It is an infrastructure maturity story — and if you are still building cloud strategy around the assumption that more cloud is always better, you are solving the wrong problem.
This post is the economic model behind the signal. Not the sentiment, not the vendor positioning — the actual calculus that determines when repatriation is the right architectural decision and when it is an expensive mistake dressed up as efficiency.
Before the repatriation calculus comes the selection calculus. Most repatriation decisions trace back to a provider selection that optimized for the wrong axis — list price, demo quality, or team familiarity — without modeling cost behavior at scale, workload alignment, or org reality. The Cloud Provider Decision Framework: AWS vs Azure vs GCP is the framework that should precede this conversation, not follow it.
What Repatriation Is Not
Repatriation is not a rejection of cloud architecture. The organizations executing repatriation strategies at scale are not abandoning public cloud — they are redistributing workloads to their optimal compute environment based on cost, data gravity, and operational maturity. That is not anti-cloud. That is architecture.
The narrative that frames repatriation as cloud failure serves vendors, not engineers. Public cloud is the right answer for a specific set of workload profiles at a specific stage of organizational scale. When those conditions change — and they do — the right answer changes with them. Treating that as failure is like calling a highway the wrong choice because you are now in a city.
The question is never “cloud or not cloud.” The question is always “which workload, at which scale, belongs where.” That calculus is necessary, but it assumes cost is the primary variable — and for a growing share of 2026 repatriation decisions, it isn’t. See The New Cloud Repatriation Strategy Isn’t About Cost for the control-and-sovereignty wave now driving workload placement independent of the break-even math below.
The Three Phases of Cloud Economics
Before examining the cost triggers, it is worth establishing why the 93% signal exists at all. Most repatriation discussions skip this context and jump straight to egress complaints. That skips the structural explanation.
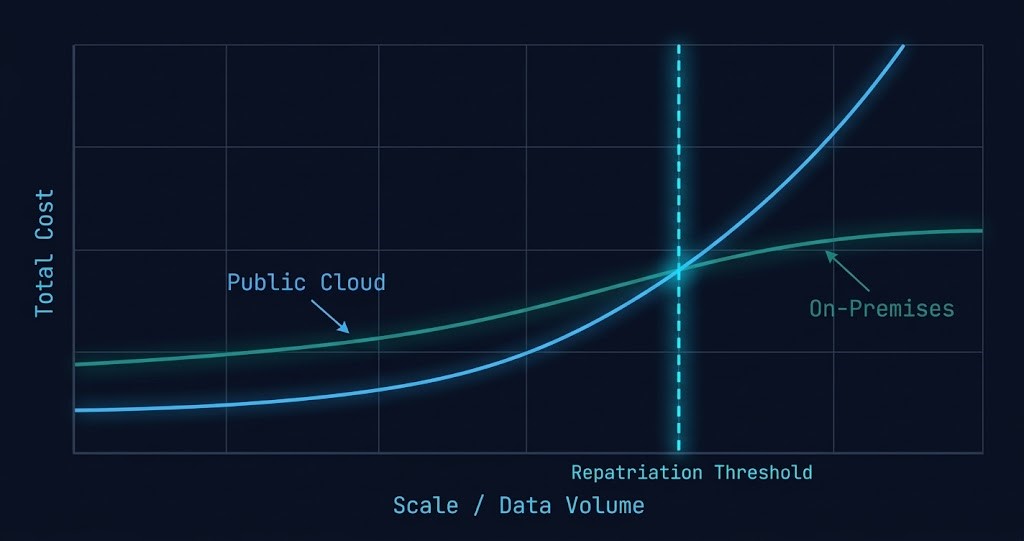
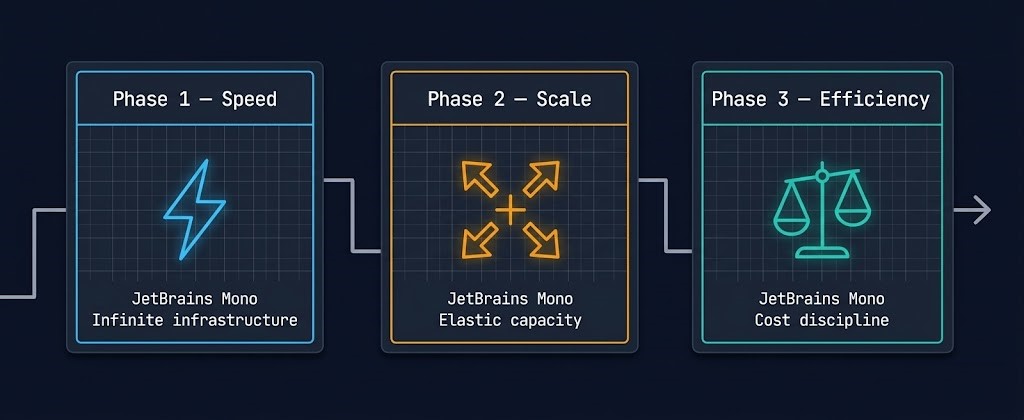
Cloud economics operate in three distinct phases. Organizations move through them in sequence, and the transition between Phase 2 and Phase 3 is where repatriation decisions begin.
| Phase | What Companies Optimize | Cloud Advantage |
|---|---|---|
| Phase 1 — Speed | Deployment velocity | Infinite infrastructure on demand |
| Phase 2 — Scale | Capacity without capital expenditure | Elastic capacity, no hardware cycles |
| Phase 3 — Efficiency | Cost discipline and unit economics | Diminishing — on-prem TCO begins to compete |
Repatriation happens when organizations transition from Phase 2 to Phase 3. The cloud advantage that justified the spend in Phase 1 and Phase 2 — infinite capacity, no hardware cycles, deployment velocity — starts to shrink relative to the cost discipline that Phase 3 demands. This is not cloud failure. It is the economic phase change of mature infrastructure.
Understanding which phase your organization is in is the first step in any honest repatriation analysis.
The Four Cost Events That Trigger Repatriation
Once an organization reaches Phase 3, four specific cost events tend to trigger the repatriation calculation. They rarely appear in isolation — they compound. And it is the compounding that makes the decision feel sudden even when the conditions have been building for years.
1. Egress Cost
Egress is the most discussed repatriation trigger because it is the most visible line item on the invoice. Moving data out of public cloud costs money — per gigabyte, every time, with no volume discount that meaningfully offsets the structural cost at scale. For workloads with high read rates, reporting pipelines, or any architecture that regularly pulls data across cloud boundaries, egress accumulates faster than most TCO models account for.
The physics of data egress do not care about your reserved instance discount. Run the numbers against your actual data transfer volume using the <a href=”https://www.rack2cloud.com/real-world-egress-calculator/”>Cloud Egress Calculator</a> before accepting any vendor TCO estimate. For a deeper look at how egress compounds structurally, the <a href=”https://www.rack2cloud.com/physics-of-data-egress/”>Physics of Data Egress</a> covers the full cost model.
2. Licensing Overhead
Bring-your-own-license models sound straightforward until you discover that cloud providers charge infrastructure premiums that are not present in the license agreement. SQL Server on EC2, Oracle on Azure, Windows workloads at scale — the licensing math in cloud environments consistently exceeds on-premises equivalents once infrastructure markup is factored in. This is a structural feature of the cloud business model, not an oversight.
3. Platform Tax
Platform tax is the silent killer of cloud TCO models. It is the delta between what a managed cloud service costs and what the equivalent self-hosted infrastructure would cost — and it is almost never modeled honestly in initial cloud migration business cases.
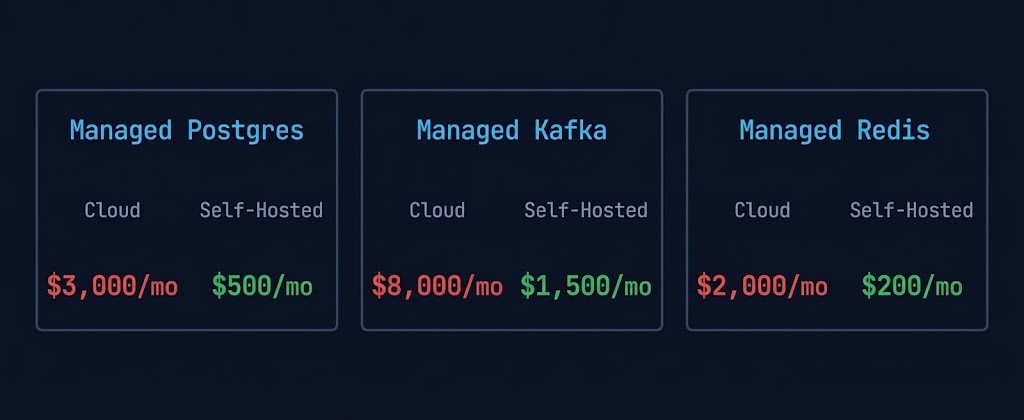
These numbers are not edge cases. They are representative of what mature engineering teams discover when they run an honest self-hosted equivalent analysis. The managed service premium funds the provider’s operational overhead, support model, and margin — not your infrastructure efficiency. At small scale the trade is reasonable. At Phase 3 scale, it is not.
4. Operational Gravity
Operational gravity is the accumulated weight of engineering decisions, integrations, and workflows that make workloads harder to move over time. It compounds quietly. Every cloud-native service dependency, every managed pipeline, every API integration adds a weight that is not visible in the cost model until you try to lift it.
Data Gravity
Data gravity is a specific and increasingly dominant form of operational gravity. Large datasets create location lock-in — not because of contracts, but because of physics. When datasets exceed certain sizes, moving compute to the data becomes cheaper than moving data to the compute. This is not a preference. It is an architectural constraint.
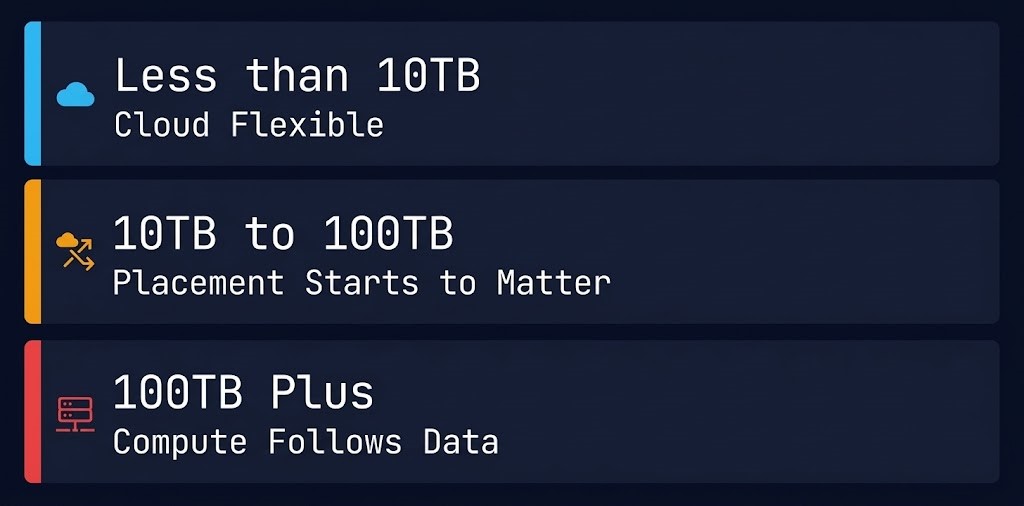
At 100TB+, you do not move the data. You move the compute. This is the architectural principle that explains why AI workloads are repatriating first — training datasets routinely exceed this threshold, and the egress cost of feeding cloud GPU instances from cloud storage at petabyte scale becomes a structural cost problem, not an optimization problem.
Modeling the Repatriation Break-Even Point
The repatriation break-even is the point at which on-premises total cost of ownership drops below equivalent cloud spend when all four cost events are included. Most organizations never model it correctly because they compare cloud invoices against hardware quotes — and hardware quotes do not include staffing, power, cooling, or lifecycle replacement.
A complete break-even model requires six inputs on each side. Cloud side: compute instance cost (reserved and on-demand blend), storage cost across all tiers in use, egress cost against actual monthly transfer volume, platform tax delta, licensing overhead, and engineering time for cloud ops and FinOps. On-premises side: hardware amortized over a five-year lifecycle, power and cooling at fully loaded PUE, colocation or data center footprint, staffing for infrastructure engineering not accounted for in cloud ops, software licensing, and hardware refresh and maintenance contracts.
The break-even point varies significantly by workload profile and organizational scale. For stable, predictable workloads with high data volumes, break-even typically appears between 18 and 36 months after repatriation. For variable or burst workloads, cloud often remains cost-competitive indefinitely. The calculation is not universal — it is workload-specific. The movement constraint model that determines whether repatriation is in the Free, Conditional, or Prohibited zone — across egress economics, data gravity, identity lock-in, operational capability, and regulatory constraints — is at Movement Architecture, the Operational stage of the Cloud Strategy Architecture Learning Path.
Once a workload clears the movement constraint check, the break-even model above — egress, platform tax, licensing, operational gravity versus hardware, power, staffing, lifecycle — is the same cost structure that Economic Architecture, the Operational stage that follows Movement Architecture in the Cloud Strategy path, formalizes (Framework #131: Economic Gravity Boundary). The four cost events that trigger repatriation — egress, licensing overhead, platform tax, and operational gravity — map directly onto the Egress Load, Reservation Lock, Idle Drag, and Exit Premium forces that determine whether a cloud portfolio is Economic-Blind or economically governed.
This is why a blanket repatriation strategy is as wrong as a blanket cloud strategy. The architecture has to follow the economics, and the economics are different for every workload class.
Why AI Workloads Repatriate First
The 93% signal is concentrated in AI workloads for three specific reasons. These are not sentiment-driven — they are architectural and economic drivers that make AI the highest-friction workload class in public cloud at scale.
GPU Utilization. Cloud GPUs make economic sense when utilization is unpredictable and burst capacity is genuinely needed. Stable, repeatable training pipelines favor owned GPUs. When you can predict GPU demand within 20%, the cloud premium for on-demand access stops being justified by the flexibility it provides.
Storage Throughput. Training pipelines move petabytes of data. Cloud storage I/O costs — particularly at the throughput levels required for large model training — dominate the infrastructure bill. When storage throughput cost exceeds compute cost, the architecture is misaligned and repatriation is the structural correction.
Model Iteration Frequency. Frequent training cycles amplify every cost category simultaneously — compute, egress, and checkpoint storage all scale with iteration count. Teams running daily or weekly retraining cycles discover that iteration frequency is a cost multiplier that was never in the original cloud business case. This is why AI teams repatriate first and fastest.
The convergence of these three drivers explains the 93% figure. It is not dissatisfaction with cloud capabilities — it is the economic physics of mature AI infrastructure at scale. For workloads still in exploratory or low-iteration phases, cloud remains the right answer. For production AI with stable pipelines and high data volumes, the calculus has shifted.
Market Signal Evidence
The repatriation trend is not theoretical. Several well-documented cases established the pattern before the 93% survey confirmed it at scale.
Dropbox moved approximately 600 petabytes of data from AWS to its own custom-built infrastructure, citing the cost structure at that data volume as the primary driver. The engineering team published detailed post-mortems on the decision. The savings were material enough to affect gross margin reporting.
37signals — the company behind Basecamp and HEY — executed a full cloud exit and documented it publicly. Their analysis showed that at their workload profile and scale, owned hardware delivered equivalent reliability at a fraction of the ongoing cost. They were explicit that the decision was economic, not ideological.
GitHub’s early infrastructure evolution followed a similar pattern — scaling on bare metal when the economics of cloud at their data volume stopped making sense. The pattern repeats consistently: high data volume, predictable workload, mature engineering team, Phase 3 economics.
These are not anti-cloud stories. They are architecture-follows-economics stories. The organizations that executed these moves did not abandon cloud for all workloads — they repatriated the workloads where the calculus had shifted and kept cloud where it remained the right answer.
False Repatriation — When It Fails

False repatriation is not uncommon. The organizations that execute it successfully treat it as an architecture project, not a cost-cutting exercise. The ones that struggle treat it as a procurement exercise — buy hardware, move workloads, expect savings. The savings do not materialize because the full cost model was never built.
The Decision Framework — Stay, Hybrid, or Repatriate
The framework below is a starting point, not a rule. Every organization’s break-even point is different, and the workload profile within a single organization rarely fits one category cleanly. The correct approach is workload-by-workload analysis informed by the four cost events, not a blanket direction in either dimension.
For the workloads where cloud remains the right answer — burst compute, global distribution, managed services at sub-threshold scale — keep them there. For the workloads where the calculus has shifted, model the break-even honestly and move with architectural discipline. The Cloud Architecture Strategy pillar covers the full placement decision framework across AWS, Azure, and GCP. The Logic of Repatriation post goes deeper on the workload-by-workload evaluation criteria. For the inverse analysis — workloads that should stay in cloud regardless of scale — see Which Workloads Should Never Leave the Cloud.
Before accepting any vendor repatriation estimate, run your actual monthly data transfer volume through the Cloud Egress Calculator. It models egress cost across AWS, Azure, and GCP against your real transfer profile — not the vendor’s optimistic assumptions. The break-even analysis starts here.
→ Run the Egress ModelAdditional Resources
Q: What is cloud repatriation?
A: Cloud repatriation is the process of moving workloads, data, or applications from public cloud infrastructure back to on-premises or colocation environments. It is not a rejection of cloud architecture — it is a workload placement decision driven by cost, data gravity, and operational maturity at scale.
Q: When does cloud repatriation make financial sense?
A: Repatriation typically makes financial sense when the combined cost of egress, platform tax, licensing overhead, and operational gravity exceeds the total cost of on-premises infrastructure including staffing, power, cooling, and hardware lifecycle. For most organizations this threshold appears between 18 and 36 months after the break-even analysis is run honestly.
Q: Why are AI workloads repatriating first?
A: AI workloads repatriate first because three cost drivers converge simultaneously — GPU utilization patterns favor owned hardware for stable training pipelines, storage throughput costs dominate at petabyte-scale training data volumes, and frequent model iteration cycles multiply every cost category. The combination makes AI the highest-friction workload class in public cloud at scale.
Q: What is platform tax in cloud computing?
A: Platform tax is the cost delta between a managed cloud service and its self-hosted equivalent. Managed Postgres, Kafka, and Redis on cloud providers carry significant premiums over equivalent self-hosted infrastructure. At small scale the trade is reasonable. At Phase 3 organizational scale, platform tax becomes one of the primary repatriation triggers.
Q: What is data gravity and how does it affect repatriation decisions?
A: Data gravity is the architectural constraint created by large datasets — once a dataset exceeds certain size thresholds, moving compute to the data becomes cheaper than moving data to the compute. For datasets under 10TB, cloud placement is flexible. For datasets over 100TB, compute typically follows data, making repatriation the structurally correct answer regardless of other cost factors.
Q: What are the most common false repatriation failure modes?
A: The four most common false repatriation failures are: ignoring staffing cost, underestimating hardware lifecycle in the TCO model, not modeling power and cooling fully, and attempting to rebuild cloud service complexity on-premises rather than simplifying the architecture. Repatriation succeeds when treated as an architecture project, not a procurement exercise.
Editorial Integrity & Security Protocol
This technical deep-dive adheres to the Rack2Cloud Deterministic Integrity Standard. All benchmarks and security audits are derived from zero-trust validation protocols within our isolated lab environments. No vendor influence.
R.M.
Senior Solutions Architect with 25+ years of experience in HCI, cloud strategy, and data resilience. As the lead behind Rack2Cloud, I focus on lab-verified guidance for complex enterprise transitions. View Credentials →
Get the Playbooks Vendors Won’t Publish
Field-tested blueprints for migration, HCI, sovereign infrastructure, and AI architecture. Real failure-mode analysis. No marketing filler. Delivered weekly.
Select your infrastructure paths. Receive field-tested blueprints direct to your inbox.
- > Virtualization & Migration Physics
- > Cloud Strategy & Egress Math
- > Data Protection & RTO Reality
- > AI Infrastructure & GPU Fabric
Zero spam. Includes The Dispatch weekly drop.
Need Architectural Guidance?
Unbiased infrastructure audit for your migration, cloud strategy, or HCI transition.
>_ Request Triage Session