Your AI Cluster Is Idle 95% of the Time
Your gpu utilization dashboard reads 40%. The cluster is healthy. The GPUs are loaded. Work is happening.
Except it isn’t.
That 40% gpu utilization figure is a peak average across a monitoring window. What it doesn’t show is the seven minutes before that spike when every GPU in the cluster was resident in memory, warm, waiting — and producing nothing. It doesn’t show the forty minutes after, when the inference queue drained and the cluster sat fully provisioned against a trickle of requests it could have handled with two nodes.
The cluster isn’t underutilized. It is mispriced against actual demand.
That is a different problem, with a different root cause, and a different fix. Idle is the symptom. Mispriced capacity is the diagnosis. And the mistake that created it didn’t happen in your scheduler or your observability stack. It happened at design time, before a single workload ran.
Why GPU Utilization Numbers Lie
The first lie is the metric itself.
GPU utilization, as reported by most monitoring platforms, conflates two things that have almost nothing to do with each other: memory residency and compute activity. A GPU can be fully loaded in VRAM — model weights resident, tensors staged, inference engine warm — and simultaneously producing zero output. The Kubernetes GPU resource model itself treats GPU allocation as binary — assigned or not — with no native distinction between memory-resident and compute-active states. The hardware is occupied. No work is being done.
This is not a monitoring gap. It is an architectural misunderstanding baked into how teams think about GPU capacity.
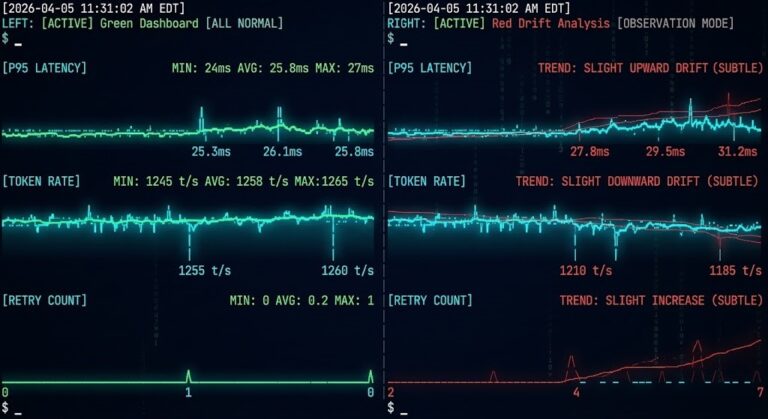
The second lie is peak-window averaging. A cluster that spikes to 80% utilization for four minutes every hour and idles at 3% for the remaining fifty-six minutes will report a utilization figure somewhere between those two numbers, depending on your aggregation window. Neither number tells you what you actually need to know: what is the sustained compute demand this cluster is priced against?
The third lie is the most expensive one.
Loaded ≠ Active.
A model resident in VRAM is not a GPU doing work. It is a GPU holding a reservation. The memory is occupied. The compute units are not. Most teams treat model-loaded status as GPU-in-use status — and provision accordingly. That single assumption is responsible for more mispriced AI capacity than any scheduling inefficiency or orchestration gap.
The cost layer nobody modeled in AI inference isn’t compute overage. It’s compute that was priced as active because it was loaded.
The Three GPU Idle Modes
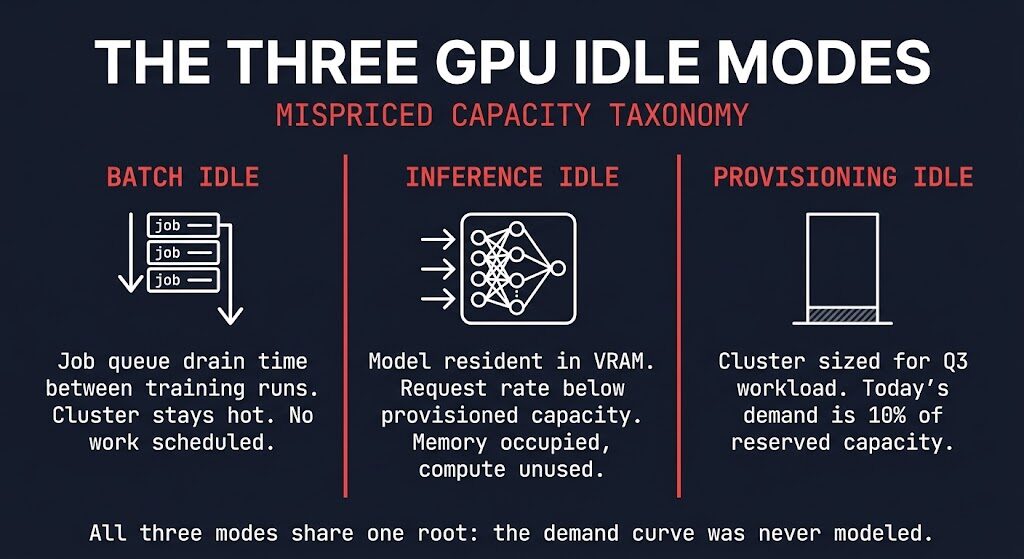
Not all idle compute is the same problem. Before you can fix the architecture, you need to name which mode you’re in. There are three.
Batch Idle is the gap between training runs. The cluster is provisioned for a distributed training workload. The job finishes. The next job hasn’t been scheduled yet. The cluster stays hot — GPU memory allocated, fabric active, nodes warm — because cold startup costs are high and nobody wants to wait for cluster initialization at the start of the next run. That gap, multiplied across a training schedule, is pure idle compute priced at full cluster cost.
Inference Idle is the gap between the capacity you provisioned and the request rate that actually arrived. The model is loaded. The inference engine is warm. Requests are coming in — just not at the rate the cluster was sized for. GPU orchestration tooling will show gpu utilization metrics as occupied. The memory utilization is real. The compute utilization is not. This is the loaded ≠ active problem in its most common production form.
Provisioning Idle is the earliest failure and the most expensive one over time. The cluster was sized for a workload that hasn’t arrived yet. Peak inference demand for Q3. The large model run that’s six weeks out. The concurrency profile from a product that hasn’t launched. The hardware is live, the cost is running, and the demand it was priced against exists only in a planning document.
All three modes share one root cause. The demand curve was never modeled correctly.
This Was a Forecasting Failure
The framing that gets used for this problem is utilization. The dashboard shows low numbers, so the fix must be better scheduling, better bin-packing, better autoscaling. That framing is wrong, and it leads to the wrong remediation.
Low utilization is an output. The input was a provisioning decision made without adequate demand modeling. The cluster wasn’t mismanaged into inefficiency — it was architected into it, before the first workload ran.
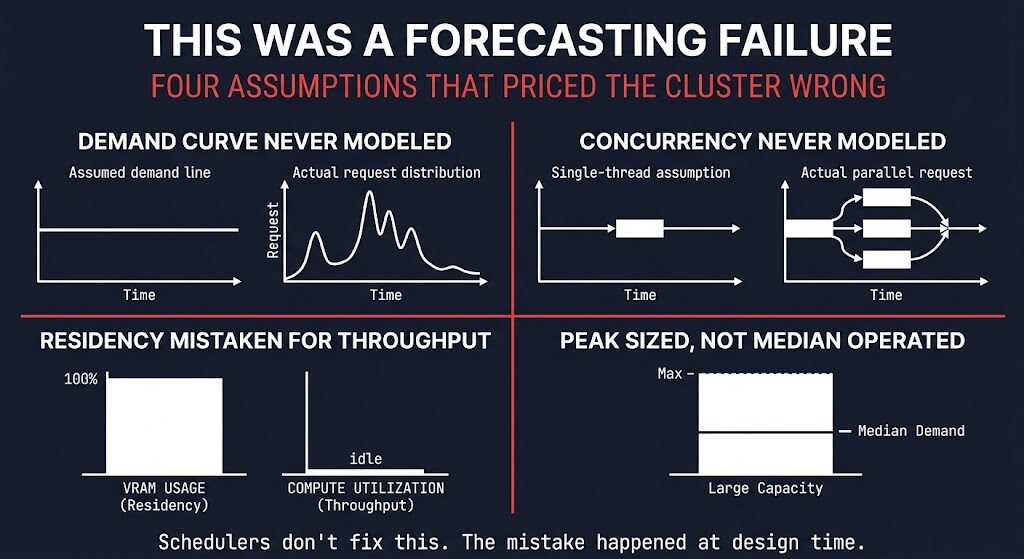
Here is what the forecasting actually missed.
The demand curve was never modeled. Teams provisioned for theoretical peak — the busiest inference scenario, the largest training run, the maximum concurrent users — without modeling what the actual request distribution looks like across a typical operating window. Peak is real. It is also rare. The cluster runs at median demand most of the time, and median was never part of the capacity calculation.
Concurrency was assumed, not measured. Most inference provisioning decisions are made against a single-request mental model — how fast can the cluster serve one request? — rather than against a concurrent request distribution. The cost of running model routing in production at real concurrency levels is systematically higher than single-request benchmarks suggest, and systematically lower than worst-case peak assumptions imply. The actual number was available. Nobody modeled it. The AI Inference Saturation Analyzer exists specifically for this step — modeling the concurrency knee and effective interactive capacity before the provisioning decision is made, not after the cluster is already idle.
Residency was mistaken for throughput. This is the loaded ≠ active failure applied to provisioning. The training/inference hardware split that emerged in 2025 and 2026 makes this worse — teams provision inference clusters against training-era intuitions about GPU memory and compute relationship, which don’t transfer cleanly. A GPU holding a 70B parameter model in VRAM is not a GPU running at capacity. It is a GPU with a very expensive reservation.
The storage and pipeline layer that makes this forecasting failure structural — where data delivery, checkpoint design, and throughput constraints determine whether provisioned compute runs or stalls — is covered in the Storage & Data Pipeline Architecture stage of the AI Architecture Learning Path.
Runtime limits were never set. Capacity was provisioned without a corresponding model of what would constrain it. Without execution budgets, the cluster expands to fill whatever headroom exists — and headroom was built in generously, because the demand model was peak-anchored.
Most teams never modeled the demand curve. They sized for theoretical peak, provisioned for future concurrency, and treated loaded memory as active work.
Did you model request concurrency before you provisioned — or did you just size for the busiest hour you could imagine?
What the Math Actually Looks Like
The numbers don’t require a full TCO model to make the point.
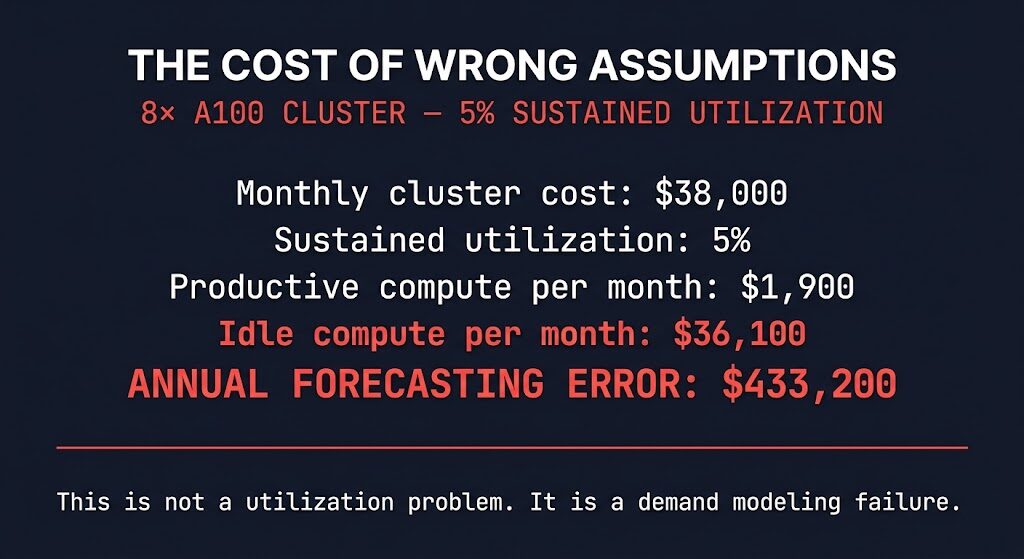
An 8× A100 cluster — on-premises or cloud-equivalent — runs approximately $38,000 per month in total cost of ownership when you account for compute, memory, fabric, and operational overhead.
Cluster: 8× NVIDIA A100
Monthly cost: $38,000
Sustained utilization: 5%
Productive compute/month: $1,900
Idle compute/month: $36,100
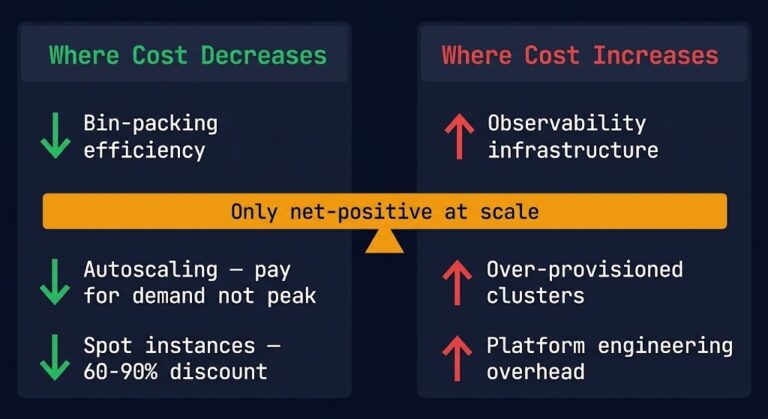
Annual forecasting error: $433,200This is not a slightly inefficient cluster. It is a six-figure architecture constraint that compounds every month the provisioning assumption goes uncorrected. The FinOps framing of cloud cost as an architectural input applies here with more force than almost anywhere else in infrastructure — because GPU capacity is expensive, provisioning decisions are long-lived, and the feedback loop between utilization data and capacity correction is slow.
The math is not the lesson. The lesson is that the math was always available, and the capacity decision was made without it.
This Is an Architecture Problem, Not a Scheduling Problem
This is where the remediation conversation usually goes wrong.
The standard response to low GPU utilization is a scheduling intervention: deploy Volcano, tune KEDA, implement DCGM-based autoscaling, improve bin-packing. These are real tools. They solve real problems. They do not fix this one.
Schedulers optimize the execution of work that has been correctly provisioned for. They distribute load, reduce fragmentation, improve queue throughput, and minimize startup latency. What they cannot do is retroactively correct a demand model that was wrong at design time. If the cluster was provisioned for 10× the actual sustained request rate, a better scheduler produces a more efficiently idle cluster.
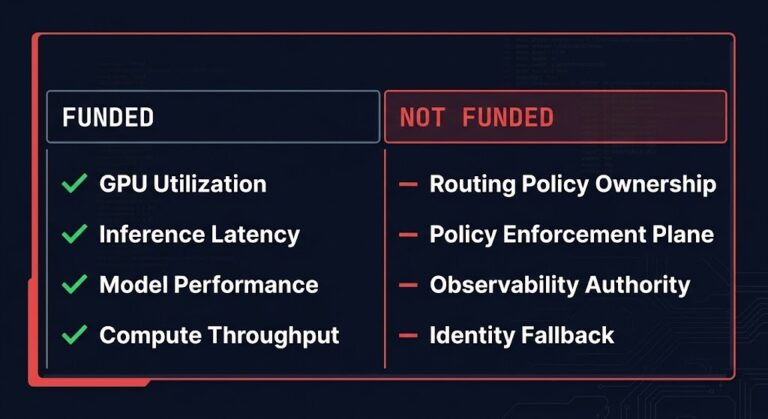
The control plane problem in AI infrastructure is not primarily a scheduling problem — it is a placement and provisioning problem that surfaces as a scheduling problem because scheduling is where the symptoms are visible. Every infrastructure decision now looks like a control plane decision — and GPU capacity is no exception. The control plane for an AI cluster is the demand model that preceded provisioning. That is where the architecture failed.
If you want to model the placement decision correctly before the next provisioning cycle, the AI Gravity & Placement Engine was built for exactly this — workload placement and cost modeling across deployment targets before capacity commitments are made.
Schedulers can distribute work. They cannot fix demand you modeled incorrectly.
That fix happens before the cluster exists. It happens at design time, against a demand curve someone actually drew.
GPU scheduling only works when the provisioning decision was already correct — what good scheduling looks like once the demand model is right. But if the demand model is wrong, that conversation starts a step too late.
Architect’s Verdict
The gpu utilization problem is not a utilization problem. It is a forecasting problem that manifests as gpu utilization data, gets diagnosed as a scheduling problem, and gets treated with tooling that addresses the symptom while the root cause compounds every billing cycle.
The central mistake is one of category error: treating memory residency as compute activity. A model loaded in VRAM is not a GPU doing work. It is a GPU holding a reservation against demand that was modeled at peak, assumed at concurrency, and imagined at scale. Every GPU idle mode — batch, inference, provisioning — traces back to a demand curve that was never drawn or was drawn incorrectly against theoretical maximums that rarely materialize in production.
The teams that solve this are not running more sophisticated schedulers. They are provisioning against actual request distributions, modeling concurrency from measurement rather than assumption, and treating loaded memory as exactly what it is: an expensive placeholder. The architecture fix is upstream of every operational tool in the stack. Fix the demand model first. Everything else is optimization on top of a correctly sized foundation.
Additional Resources
Editorial Integrity & Security Protocol
This technical deep-dive adheres to the Rack2Cloud Deterministic Integrity Standard. All benchmarks and security audits are derived from zero-trust validation protocols within our isolated lab environments. No vendor influence.
R.M.
Senior Solutions Architect with 25+ years of experience in HCI, cloud strategy, and data resilience. As the lead behind Rack2Cloud, I focus on lab-verified guidance for complex enterprise transitions. View Credentials →
Get the Playbooks Vendors Won’t Publish
Field-tested blueprints for migration, HCI, sovereign infrastructure, and AI architecture. Real failure-mode analysis. No marketing filler. Delivered weekly.
Select your infrastructure paths. Receive field-tested blueprints direct to your inbox.
- > Virtualization & Migration Physics
- > Cloud Strategy & Egress Math
- > Data Protection & RTO Reality
- > AI Infrastructure & GPU Fabric
Zero spam. Includes The Dispatch weekly drop.
Need Architectural Guidance?
Unbiased infrastructure audit for your migration, cloud strategy, or HCI transition.
>_ Request Triage Session