Kubernetes Cost Density Calculator
Deterministic diagnostic for node efficiency, scheduling fragmentation, and workload utilization gaps — with architectural interpretation of what your cluster topology reveals about your operating model.
Most Kubernetes cost problems are diagnosed at the wrong layer. The billing dashboard shows monthly spend. The utilization dashboard shows CPU and memory consumption. Neither answers the actual question: why is so much allocated capacity not doing useful work, and what structural condition produced that gap?
The Kubernetes Cost Density Calculator is built around that distinction. It takes your cluster profile, scheduling configuration, and utilization inputs and returns an architectural interpretation of what that combination reveals about your operating model — not a savings estimate.
What the Calculator Surfaces
01 — CLUSTER PROFILE
Node count, vCPU and RAM per node, cluster platform (EKS/AKS/GKE/self-managed), workload mix, autoscaler type, and namespace count. These inputs establish the structural baseline that weights the density output.
02 — UTILIZATION & SCHEDULING INPUTS
CPU and memory requests vs actual utilization, average pod density, pod size distribution, spot ratio, DaemonSet and system overhead percentage, anti-affinity and topology constraints, node pool segmentation, and active namespace ratio. These are the scheduling behavior inputs that determine where density is lost.
03 — DENSITY ANALYSIS ENGINE
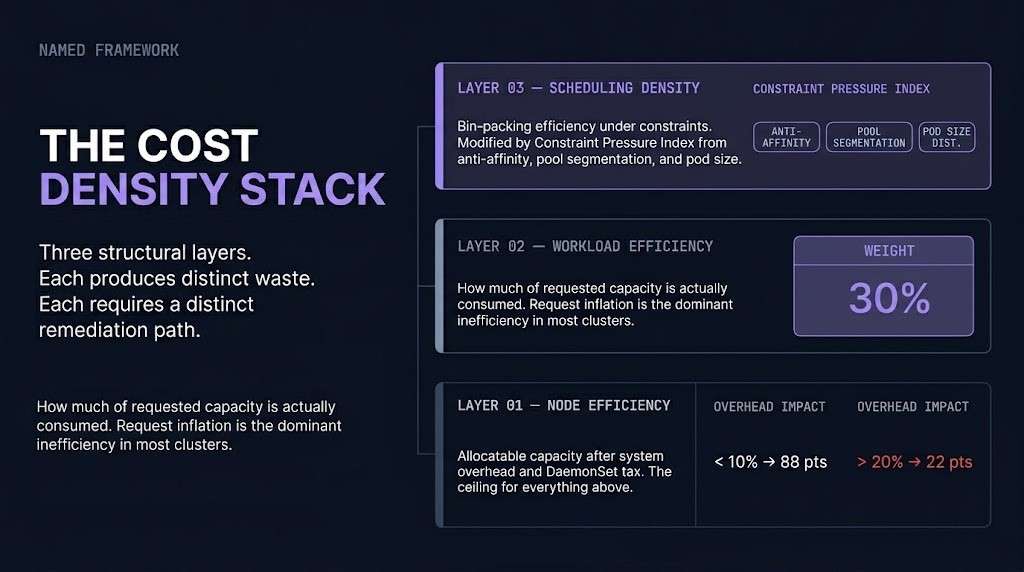
Five weighted metrics — Workload Efficiency (30%), Scheduling Density (25%), Node Efficiency (20%), Operational Fragmentation (15%), System Overhead Ratio (10%) — combined into a Cost Density Score. The Constraint Pressure Index, derived from anti-affinity configuration, pool segmentation, and pod size distribution, applies as a modifier to Scheduling Density and Operational Fragmentation before the final score assembles.
03B — VISUALIZATION LAYER
Four visual outputs modeled from your inputs: a synthetic node heatmap showing utilized, reserved, and stranded capacity across your node grid; a density breakdown bar showing per-metric score contributions; a pod packing grid showing scheduling gaps and constraint-forced spacing on a representative node; and a utilization vs reservation chart showing the requests-to-actuals gap for CPU and memory.
04 — WASTE PATTERN & ARCHITECTURAL ARCHETYPE
The calculator maps your input combination to one of four waste patterns and one of five architectural archetypes — deterministically, not through probabilistic scoring. Same inputs produce the same output every time. The archetype names the operating model condition behind your density profile, not just the score.
05–07 — BENCHMARK POSITION, REMEDIATION & MATURITY
Industry benchmark position anchored to CAST AI 2026 and Datadog Container Report data. Top three remediation priorities weighted by structural density impact — architectural framing only, no savings estimates. Four-stage Infrastructure Density Maturity model from Unoptimized Scheduling through Cost-Dense Kubernetes.
08 — DENSITY DELTA ANALYSIS
Session-only comparison between two configuration states. Save a baseline, adjust inputs, run again — the Density Delta shows the score change, per-metric shifts, and archetype change between optimization passes. Nothing persists after the browser tab closes.
The Cost Density Stack
The three-layer framework the calculator is built on. Each layer has a distinct waste mechanism and a distinct remediation path.
THE COST DENSITY STACK
- Node Efficiency — how much of provisioned node capacity is available for workload scheduling, after system overhead and DaemonSet tax. The ceiling for everything above it.
- Workload Efficiency — how much of requested capacity is actually consumed. Request inflation is the dominant inefficiency in most clusters — pods claim resources the scheduler respects but the workload never uses.
- Scheduling Density — how efficiently the scheduler fills available capacity, constrained by anti-affinity rules, topology spread, pool segmentation, and pod size distribution. The Constraint Pressure Index modifies this layer directly.
The GPU Utilization post identifies the same three-layer structure operating at higher cost density inside GPU pools — where the same scheduling, placement, and fragmentation mechanics compound into the GPU Waste Triangle. The Cost Density Stack applies to Kubernetes CPU/memory workloads; the GPU Waste Triangle is its AI infrastructure counterpart.
The Five Architectural Archetypes
| Archetype | Primary Signature | Dominant Density Limiter |
|---|---|---|
| Fragmented Enterprise | Over-segmented node pools + high Operational Fragmentation | Scheduling Fragmentation |
| Isolation-Heavy Platform | Heavy anti-affinity + namespace sprawl + high Constraint Pressure | Constraint Pressure Index |
| Elastic Optimizer | Strong autoscaler + high pod density + low Fragmentation Tax | Request Inflation (residual) |
| Over-Provisioned Cluster | High requests-to-actuals gap across CPU and memory | Request Inflation |
| Control Plane Heavy | Small cluster + system overhead >20% + low node count | System Overhead Ratio |
Archetypes fire deterministically based on input combinations. The output is reproducible and auditable — the same cluster inputs produce the same archetype classification every time.
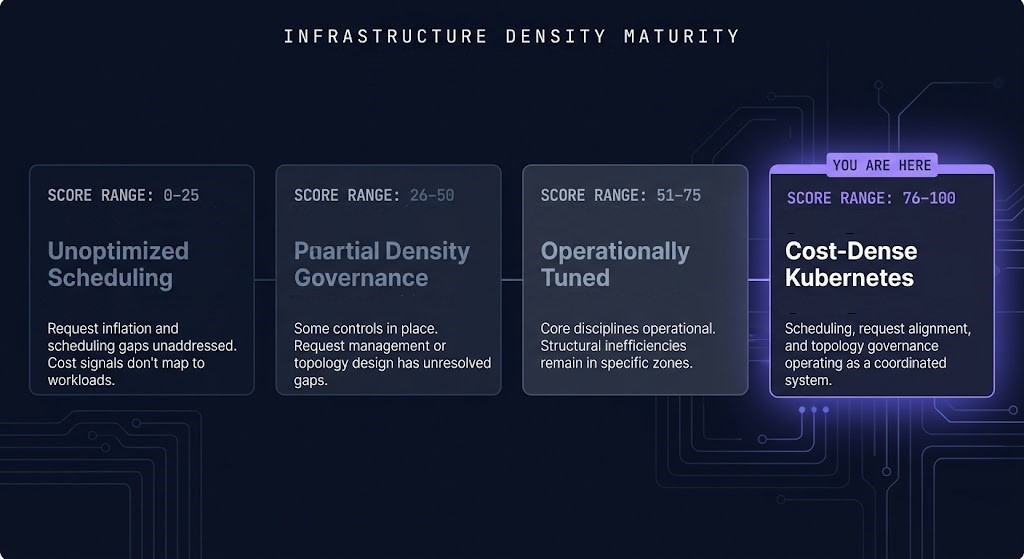
Infrastructure Density Maturity
The maturity score reflects how much structural and governance work has been applied to prevent scheduling inefficiency — not how well workloads perform under load.
| Score | Stage | Characteristic |
|---|---|---|
| 0–25 | Unoptimized Scheduling | Request inflation and scheduling configuration have not been addressed as architectural constraints. Cost signals do not map reliably to workload patterns. |
| 26–50 | Partial Density Governance | Some efficiency controls in place. Request management, autoscaling configuration, or topology design have unresolved gaps. Improvements available without architectural changes. |
| 51–75 | Operationally Tuned | Core scheduling and request management disciplines operational. Structural inefficiencies remain in specific zones — pool segmentation, namespace lifecycle, or constraint pressure. |
| 76–100 | Cost-Dense Kubernetes | Scheduling efficiency, request alignment, and topology governance operating as a coordinated system. Marginal improvements require workload-specific tuning. |
Kubernetes Cost Density Calculator: Key Features
- Cost Density Score — composite 0–100 score across five weighted metrics. Not a savings estimate. A structural efficiency signal.
- Fragmentation Tax — explicit named metric for wasted allocatable capacity from scheduling fragmentation. Surfaces the bin-packing efficiency gap the scheduler cannot recover automatically.
- Constraint Pressure Index — derived modifier from anti-affinity configuration, node pool segmentation, and pod size distribution. Applied to Scheduling Density and Operational Fragmentation before final score assembly. Appears as a labeled factor in the output.
- Dominant Density Limiter — single primary bottleneck surfaced alongside the final score. One architectural explanation for why density is where it is.
- Architectural Archetypes — five named operating model patterns. Deterministic, not probabilistic. The archetype names the structural condition, not just the score band.
- Density Delta Analysis — session-only comparison between optimization passes. Save a baseline, adjust configuration inputs, run again — the delta shows structural improvement between passes.
- Share Architecture Snapshot — exportable card with score, archetype, dominant limiter, and one-line diagnosis. Copy as text or download as PNG.
- Client-Side Only — no data leaves the browser. No telemetry, no server-side logging, no account required.
THE DIAGNOSTIC NAMES THE PATTERN.
A REVIEW MAPS IT TO YOUR ENVIRONMENT.
A Cost Density Score identifies where structural inefficiency is. A Cost Architecture Review translates that into a sequenced action plan against your actual cluster configuration, team structure, and workload requirements.
Cost Architecture Review
Structured review of your Kubernetes cost posture against your cluster profile, density findings, and workload requirements.
- > Request inflation audit across workload types
- > Node pool segmentation assessment
- > Autoscaler configuration review
- > Sequenced density remediation roadmap
Architecture Playbooks. Field-Tested Blueprints.
Kubernetes cost governance, platform consolidation, and scheduling efficiency patterns delivered as field-tested operational blueprints.
- > Kubernetes cost density governance
- > Request and limits management at scale
- > Node pool consolidation patterns
- > Autoscaler configuration blueprints
Zero spam. Unsubscribe anytime.
Frequently Asked Questions
Q: What does the Cost Density Score measure?
A: The Cost Density Score is a 0–100 composite built from five weighted metrics: Workload Efficiency (30%), Scheduling Density (25%), Node Efficiency (20%), Operational Fragmentation (15%), and System Overhead Ratio (10%). It measures how efficiently your cluster converts provisioned capacity into useful workload execution — not how much you could save by rightsizing. The Constraint Pressure Index, derived from anti-affinity rules, pool segmentation, and pod size distribution, applies as a modifier to two of the five metrics before the final score assembles.
Q: What is the Fragmentation Tax?
A: The Fragmentation Tax is the percentage of allocatable cluster capacity that cannot be consumed by workloads due to scheduling fragmentation — node pool boundaries, anti-affinity constraints, request inflation leaving artificial gaps, and topology spread requirements. It is the cost of architectural decisions that create scheduling dead zones the bin-packer cannot recover. High Fragmentation Tax clusters pay for capacity they cannot use, regardless of what utilization metrics show.
Q: How is this different from kubectl top or a cloud cost dashboard?
A: kubectl top and cloud dashboards measure resource consumption and spend. This calculator diagnoses the structural conditions that determine how efficiently your cluster converts provisioned capacity into workload execution — request inflation, scheduling fragmentation, topology constraints, system overhead, and pool segmentation. It explains why your cluster is where it is on the density spectrum, not just what the numbers are.
Q: What is the Density Delta Analysis?
A: The Density Delta Analysis is a session-only comparison between two analysis runs. Save your current result as a baseline, adjust your inputs to model a configuration change — consolidating node pools, tuning requests, enabling Karpenter — then run the analysis again. The delta shows the Cost Density Score change, per-metric shifts, and archetype change between passes. Nothing persists after the browser tab closes. It is a tuning instrument, not a tracking system.
Q: Is any data sent to a server?
A: No. The calculator runs entirely in the local browser session. No data is transmitted to any server, no telemetry is collected, no account is required, and nothing persists after the browser tab closes. All five sections of analysis execute as client-side JavaScript against your inputs.
🔒 Privacy Architecture: No cookies. No tracking pixels. No server-side database.
All analysis runs entirely in your local browser session against your inputs.
Visualizations are representative models — not live cluster telemetry.