Nutanix AHV vs. vSAN 8 ESA: The 2026 I/O Saturation Benchmark
Stop Testing for “Peak IOPS”
If you are designing a storage platform based on “Peak IOPS,” you are designing for a scenario that doesn’t exist. Nutanix AHV vs vSAN 8 ESA isn’t a race for speed — it is a race for survival when the buffers fill up.
Vendor benchmarks show you a Ferrari on an empty track. As an architect, I don’t care how fast the storage is when it’s empty. I care about what happens when the write buffer hits 100% saturation at 3:00 AM during a backup storm.
That is the only metric that matters: Latency Collapse.
When your backup window collides with a Patch Tuesday reboot storm, you don’t need IOPS. You need to know if the storage controller will throttle gracefully or panic and lock your SQL database.
We took vSAN 8 ESA and Nutanix AHV and flooded the write tier until they broke. Here is which one survived the saturation point — and which one fell off the cliff.
This benchmark is part of the broader Modern Virtualization Learning Path — which covers hypervisor selection, storage architecture, and migration physics as a structured progression. For the execution-level physics of what changes when you move from ESXi to AHV, see Part 1 of the Post-Broadcom Migration Series.
The Rack2Cloud “Clean Room” Protocol
We operate under a specific testing doctrine to eliminate vendor gaming:
- No Vendor Tuning: Default policies only.
- No Cache Warming: Tests run cold to simulate sudden bursts.
- No “Hero” Workloads: No 4K 100% Read tests allowed.
- Full Transparency: We publish the FIO configs and raw logs.
Editor’s Note: The NVMe drives and networking for this test were procured directly through the Rack2Cloud Lab Fund. This data belongs to the community, not a vendor. Want to replicate this test in your own environment? DigitalOcean provides cost-effective bare metal nodes that match this lab profile.
Project Thunderdome: Lab Architecture
To isolate the software performance, we removed hardware variables entirely. Both hypervisors run on identical metal.
| Component | Specification |
| Nodes | 4x Dell PowerEdge R750 (1U) |
| CPU | Dual Intel Xeon Gold 6348 (28c/56t) |
| Memory | 512GB DDR4 ECC (Per Node) |
| Network | 100GbE (Mellanox ConnectX-6 Dx) |
| Storage (Media) | 4x 3.84TB Micron 7400 Pro NVMe Gen4 (Per Node) |
| Total Raw Capacity | 61.44 TB |
Both platforms were deployed on the same physical nodes, sequentially wiped between test runs, with no persistent cache state carried between platforms.
The Physics: Write Path Architecture
To understand why these systems fail differently, you have to look at the write path. The failure mode is baked into the architecture — not the hardware.
vSAN 8 ESA: The “Sawtooth” Risk
vSAN ESA removes legacy disk groups and writes directly to a RAID-1 “Performance Leg” on NVMe.
- The Mechanism: It ingests writes aggressively until the log fills up. Then, it pauses to compress and “destage” data to the capacity leg.
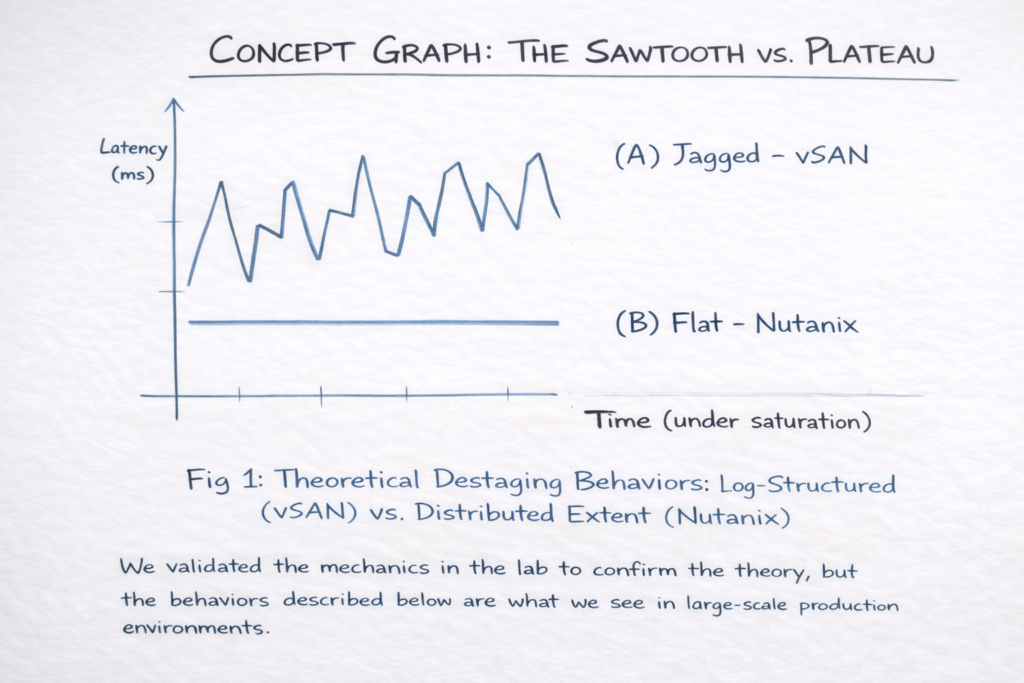
- The Failure Mode: When the buffer saturates, you get Backpressure. This creates a “Sawtooth” pattern—massive speed, followed by a sharp latency spike (p99 > 50ms) while the system catches its breath.
- The Cost: High peak speed, but high jitter. For environments running synchronous replication across sites, this jitter behavior directly impacts Metro cluster stability — a problem covered in depth in The Physics of Disconnected Cloud.
Nutanix AHV: The Plateau Strategy
Nutanix uses a Controller VM (CVM) to manage the Oplog — a persistent write buffer that sits between the guest VM and the storage fabric.
- The Mechanism: The CVM detects backend pressure early and throttles ingest before the buffer fills. It sacrifices peak throughput to preserve latency consistency.
- The Result: Instead of a sawtooth, you see a Plateau. Throughput is lower than vSAN at peak, but latency remains flat at 3–5ms under sustained load.
- The Cost: Lower top speed, but zero jitter. This architecture relies heavily on Data Locality to minimize East-West traffic. Minimizing cross-node chatter is critical for preventing switch congestion — the same principle covered in our analysis of Vendor Lock-In Through Networking.
Note: This architecture relies heavily on Data Locality to minimize East-West traffic. As we discussed in Vendor Lock-In Happens Through Networking, minimizing cross-node chatter is critical for preventing switch congestion.
Workload Modeling: Why 70/30?
We explicitly reject Hero Numbers (100% Read). Instead, we simulate a Dirty Database profile:
- Block Size: 8K / 32K Mixed
- R/W Ratio: 70% Read / 30% Write
- Duration: 4 Hours (Critical for forcing destaging)
This profile models real-world SQL/Oracle OLTP and VDI Login Storms where the system cannot serve from RAM — it must commit to disk. Anything less than 4 hours will not expose the destaging behavior that defines saturation performance.
Operational Impact Analysis
Engineers care about Latency Jitter (Variance), not Average Latency. A system that averages 2ms but spikes to 100ms kills VDI sessions.
| Workload Scenario | vSAN ESA Experience | Nutanix AOS Experience |
| VDI Login Storm | Periodic screen freezes (Cursor lag) | Slower login, but smooth desktop |
| Database Commits | High throughput, occasional p99 timeouts | Predictable commit times |
| Backup Ingest | Fastest completion time (Burstable) | Steady, linear ingest rate |
| Ransomware Recovery | Stall cycles during massive writes | Continuous, throttled rebuild |
The CPU overhead implications of this divergence are significant. If you are running high-density workloads alongside storage, the CVM’s CPU reservation on Nutanix nodes must be accounted for before sizing. See the CPU Ready vs CPU Wait guide for the exact sizing heuristics — and why undersizing the CVM produces symptoms that look like disk latency, not CPU contention.
The Verdict: There Is No Best, Only Fit
Choose vSAN 8 ESA if:
- Raw Database Power: You run massive Oracle/SQL databases that demand unbridled throughput and can tolerate occasional p99 latency spikes
- Network Bandwidth: You have a 100GbE+ backbone to support cross-node erasure coding traffic
- Density isn’t Priority: You are okay with the overhead of the vSAN stack on your CPU — see our guide on node density and overhead for why this matters at scale
Choose Nutanix AHV if:
- User Experience (VDI): You run Omnissa (Horizon) or Citrix. Users hate “jitters” more than they love “fast.”
- Consistency: You need a flat latency curve for multi-tenant workloads
- Data Locality: You want to keep read/write paths local to the node to reduce stress on your ToR switches
If you are mid-migration and need to validate which platform your current workload profile fits, run the HCI Migration Advisor before committing to hardware procurement. It surfaces snapshot depth, rebuild envelope, and CPU headroom mismatches before they become post-migration incidents.
Field Notes & References
Don’t ask your vendor for a speed test. Ask them for a saturation test. Speed is vanity; consistency is sanity.
For teams planning a full migration from vSphere to AHV, the vSphere to AHV Migration Strategy covers the operational model changes required beyond just the storage layer. And if your environment includes Metro cluster deployments, validate your RTT variance and jitter profile with the Metro Latency Scout before enabling synchronous replication.
Additional Resources
For deeper technical context on the concepts covered in this benchmark:
Editorial Integrity & Security Protocol
This technical deep-dive adheres to the Rack2Cloud Deterministic Integrity Standard. All benchmarks and security audits are derived from zero-trust validation protocols within our isolated lab environments. No vendor influence.
R.M.
Senior Solutions Architect with 25+ years of experience in HCI, cloud strategy, and data resilience. As the lead behind Rack2Cloud, I focus on lab-verified guidance for complex enterprise transitions. View Credentials →
Get the Playbooks Vendors Won’t Publish
Field-tested blueprints for migration, HCI, sovereign infrastructure, and AI architecture. Real failure-mode analysis. No marketing filler. Delivered weekly.
Select your infrastructure paths. Receive field-tested blueprints direct to your inbox.
- > Virtualization & Migration Physics
- > Cloud Strategy & Egress Math
- > Data Protection & RTO Reality
- > AI Infrastructure & GPU Fabric
Zero spam. Includes The Dispatch weekly drop.
Need Architectural Guidance?
Unbiased infrastructure audit for your migration, cloud strategy, or HCI transition.
>_ Request Triage Session