RTO, RPO, and RTA: Why Recovery Metrics Should Design Your Infrastructure
Every DR plan has an RPO. Every DR plan has an RTO. Almost none of them have an RTA.
That’s the problem.
RPO and RTO are the targets your business signed off on. RTA — Recovery Time Actual — is the number you discover at 2am when production is dark and your architecture is under real pressure for the first time. The gap between what you planned and what you delivered in that moment is the conversation no one wants to have in the post-mortem.
But here’s the thing: that gap isn’t a surprise if you’re building the right way. RPO, RTO, and RTA aren’t compliance metrics to fill into a DR policy document. They’re architecture inputs. Every storage tier decision, every replication topology, every recovery sequencing choice should flow from these three numbers — not the other way around.
Most teams get this backwards. They design the infrastructure first, run a backup vendor’s spec sheet through a spreadsheet, and then write numbers into the DR policy that look achievable. When the actual event hits, RTA blows past RTO by a factor of three and no one can explain why because no one ever designed for it.
This post is about fixing that.
What Each Metric Actually Measures — And What It Drives
These three terms are often taught as a vocabulary lesson. They’re actually a causal chain.
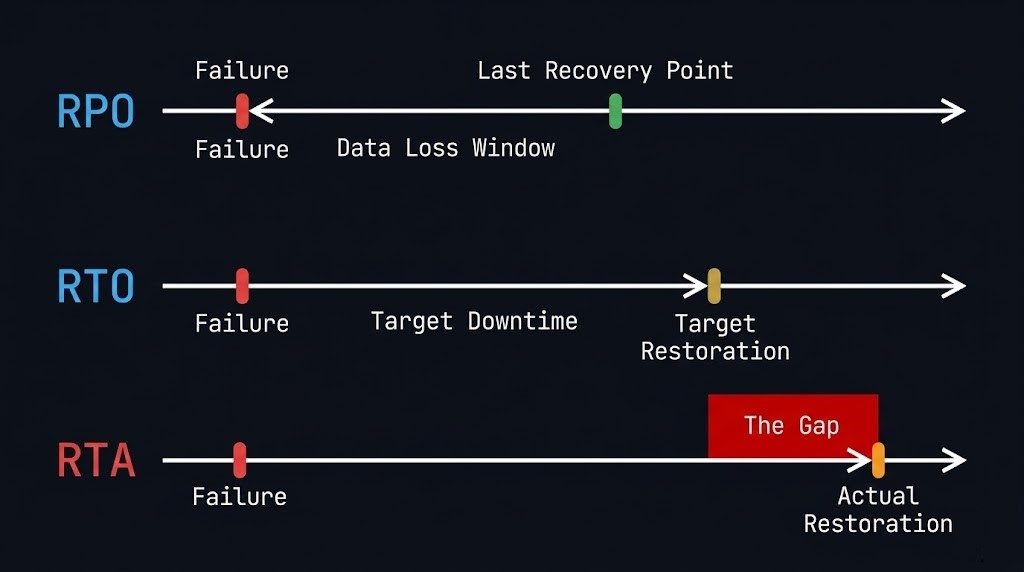
RPO — Recovery Point Objective
RPO answers the question: how much data can you afford to lose?
It’s measured backwards from the moment of failure. If your last good backup is 4 hours old when the incident occurs, your RPA (Recovery Point Actual) is 4 hours. If your RPO is 1 hour, you’ve just failed your own objective.
RPO is the constraint that drives backup frequency and replication architecture. A 15-minute RPO for a transaction database doesn’t just mean “run backups every 15 minutes.” It means you need continuous or near-continuous replication — async or synchronous depending on your tolerance for replication lag — with a recovery point that can be reached deterministically under failure conditions, not just under normal operating conditions.
The most common RPO failure mode isn’t a backup system that stopped running. It’s a backup system that ran on schedule but captured a crash-consistent snapshot of a database mid-transaction, leaving you with a recovery point that’s technically recent but structurally broken.
RTO — Recovery Time Objective
RTO answers the question: how long can the business tolerate the outage?
It’s measured forward from the moment of failure. If your SLA says 2-hour RTO and your actual recovery sequence takes 5 hours, you’ve missed it — and the business has been making decisions about that outage for 3 hours longer than they expected.
RTO drives system architecture and recovery strategy. A 15-minute RTO doesn’t just mean having a fast backup appliance. It means your recovery sequence — detection, declaration, authentication, restore initiation, data hydration, application startup, dependency resolution, validation — must complete in under 15 minutes. That chain has physics. You can’t compress it by buying a faster storage tier if three of those steps require a human to make a phone call.
RTA — Recovery Time Actual
RTA is the number nobody puts in the policy document because it only exists after the event. It’s what your recovery actually took, measured from failure declaration to confirmed service restoration.
RTA is the accountability metric. RPO and RTO are aspirational. RTA is real. And the gap between RTO and RTA is where most organisations discover that their DR plan was a document, not an architecture.
RTA is inflated by: rehydration overhead on deduplicated storage, authentication failures when identity systems are part of the affected environment, undocumented dependencies that weren’t in the recovery runbook, human coordination latency between on-call teams, and validation steps that weren’t accounted for in the RTO calculation.
None of those are storage problems. They’re architecture problems. And they’re fixable — but only if you treat RTA as a design target before the event, not a forensic finding after it.
The Architecture Chain — How Each Metric Maps to Decisions
This is where most DR documentation stops short. It defines the metrics without connecting them to the specific decisions they should drive.
RPO → Backup Frequency → Replication Architecture
| RPO Target | Architecture Implication |
|---|---|
| 24 hours | Daily full or incremental backup to local repository |
| 4 hours | Incremental every 4 hours + immutable offsite copy |
| 1 hour | Hourly incremental + async replication to secondary site |
| 15 minutes | Continuous Data Protection (CDP) or near-sync replication |
| Near-zero | Synchronous replication — understand the write latency penalty |
The column on the right isn’t a vendor recommendation. It’s a physics constraint. If you need a 15-minute RPO for a Tier 0 database, incremental backups don’t get you there architecturally — even if a vendor’s marketing says otherwise. CDP or near-sync replication is the only mechanism that delivers deterministic recovery points at that frequency under failure conditions.
The decision that follows from RPO isn’t just technology selection. It’s workload classification. Not every workload needs a 15-minute RPO. Applying near-sync replication to a dev/test environment is a cost structure decision disguised as a DR policy. Your RPO tiers should map to your workload tiers — and that mapping should be explicit, reviewed annually, and not dictated by whatever the backup vendor’s default policy sets.
RTO → Recovery Sequence → Infrastructure Design
RTO is where architecture gets uncomfortable. Because achieving a 15-minute RTO isn’t a question of how fast your restore runs. It’s a question of what your entire recovery sequence looks like when every step is under failure conditions.
The full sequence:
- Failure detection (monitoring, alerting, human acknowledgment)
- Incident declaration (escalation path, on-call response)
- Authentication to recovery systems (does this depend on production identity infrastructure?)
- Recovery initiation (automated or manual?)
- Data restore / failover initiation
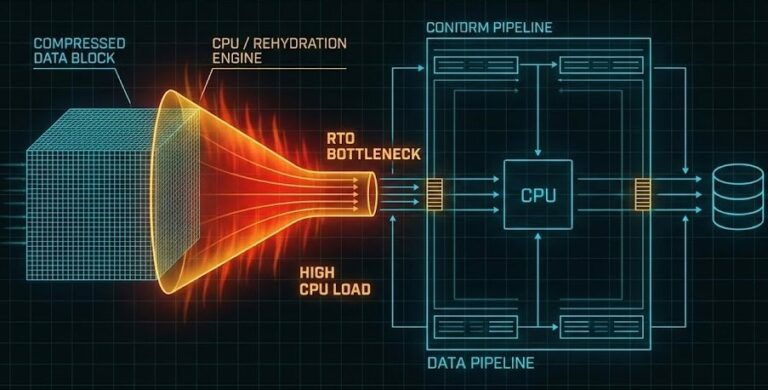
- Rehydration overhead (if deduplicated storage — this is the hidden tax)
- Application startup and dependency resolution
- Validation (smoke tests, data integrity checks)
- Traffic cutover
If step 3 requires your production Active Directory environment and that environment is what failed, you don’t have a 15-minute RTO. You have an undefined RTO. This is the logic-gapping failure mode — identity isolation for recovery systems isn’t optional for Tier 0 workloads. Read more on identity isolation in our Logic-Gapping post.
The rehydration tax in step 6 is the other silent RTO killer. If your recovery landing zone is deduplicated or compressed storage, the restore runs at rehydration speed — not storage speed. A petabyte-scale environment with an aggressive dedupe ratio can turn a theoretically fast restore into a multi-hour crawl. The Rehydration Trap covers this in detail. The architecture fix — a hydrated landing zone for Tier 0 workloads on flash-first, non-deduplicated storage — should be a direct output of your RTO target, not an afterthought.
RTA → Drill Cadence → Gap-Closing Roadmap
RTA can’t be designed in advance — it can only be measured. But the mechanism for measuring it is a recovery drill, and most organisations run drills that are too narrow to surface the gaps that actually inflate RTA in production.
A single-VM restore test is not a recovery drill. It validates your backup tooling. It does not validate your recovery sequence, your team coordination, your authentication paths, your dependency resolution, or your application startup time.
A real recovery drill that surfaces meaningful RTA data:
- Declares a full failure scenario, not just a storage failure
- Requires authentication through the recovery identity path, not production credentials
- Restores at a scale representative of the workload tier being tested
- Measures every step in the sequence with timestamps
- Includes application validation, not just “VM is running”
The RTO Reality post has the full drill framework. The point here is architectural: your drill cadence should match your RTO tier. A 4-hour RTO for a Tier 1 application should be validated quarterly. A 15-minute RTO for a Tier 0 database should be validated monthly — because the drift in human coordination and undocumented dependencies accumulates faster than most teams expect.
Tier Classification — The Foundation You Need Before Setting Any Objectives
RPO and RTO targets that aren’t anchored to a workload classification framework are just numbers. The classification is what gives them meaning — and it’s what most DR plans skip entirely.
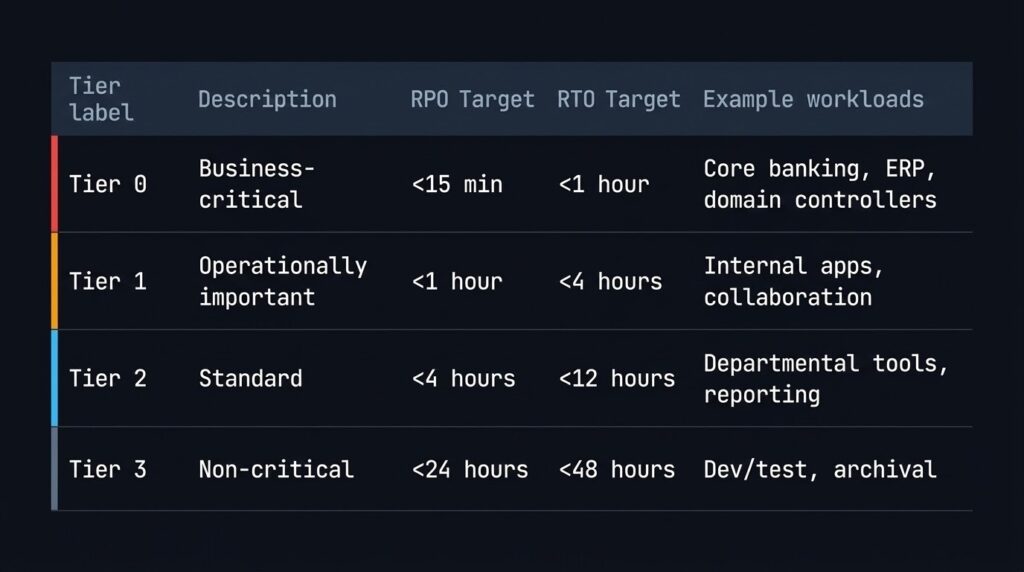
A working tier model for most enterprise environments:
| Tier | Description | RPO Target | RTO Target | Examples |
|---|---|---|---|---|
| Tier 0 | Business-critical — revenue-generating or identity-providing | < 15 min | < 1 hour | Core banking, ERP, domain controllers, payment processing |
| Tier 1 | Operationally important — significant impact if down | < 1 hour | < 4 hours | Internal apps, collaboration platforms, secondary databases |
| Tier 2 | Standard business applications | < 4 hours | < 12 hours | Departmental tools, reporting systems |
| Tier 3 | Non-critical / recoverable | < 24 hours | < 48 hours | Dev/test, archival, batch systems |
The architecture decision that follows is that each tier requires a distinct storage and replication profile. Applying a Tier 0 architecture to Tier 3 workloads wastes budget. Applying a Tier 3 architecture to Tier 0 workloads creates the gap between your RTO and your RTA.
Classification isn’t a one-time exercise. Workload criticality shifts as the business changes — a reporting database that was Tier 2 three years ago may now feed a real-time analytics pipeline that makes it Tier 1. Annual classification reviews are an architecture responsibility, not an operations checkbox.
The Most Common Ways RTA Exceeds RTO
These aren’t edge cases. They’re the standard failure modes from real production recovery events:
Authentication dependency on the failed environment. Recovery systems that authenticate against production AD or SSO are unusable when those systems are part of the failure. During the scramble, teams either wait for identity recovery first or work around it unsafely. Either way, RTA grows.
Undocumented application dependencies. The application restored fine. The upstream authentication service, the configuration management database, and the certificate authority it depends on are still down. Nobody documented those dependencies in the recovery runbook because they seemed obvious. They aren’t obvious at 2am under pressure.
Rehydration on deduplicated storage. The restore initiated cleanly. The speed is 10% of what the architecture spec assumed because the recovery landing zone is deduplicated NAS, not flash. RTO was calculated against raw storage throughput, not rehydration throughput.
Human coordination latency. The recovery sequence requires sign-off from three different team leads before traffic cutover. Two of them are on the same incident bridge. One is unreachable. This latency isn’t in the RTO calculation because it’s a people process, not a technology process. It’s still part of RTA.
Missing or stale runbooks. The recovery procedure was documented 18 months ago against infrastructure that’s been significantly changed since. The person running the recovery is executing against an outdated script. Steps fail. Improvisation takes over. RTA expands.
Every one of these is an architecture and process input, not a backup product problem.
What Your RPO and RTO Targets Should Actually Produce
If you’ve done this correctly, your RPO and RTO targets — per workload tier — should generate:
From RPO:
- A backup frequency schedule per tier
- A replication topology decision (none / async / near-sync / sync) per tier
- A storage architecture for each replication tier (what media, what durability class)
- A recovery point validation procedure (crash-consistent vs app-consistent, tested under failure conditions)
From RTO:
- A recovery sequence document with step-level timing estimates
- An identity isolation design for recovery systems
- A storage tier decision for recovery landing zones (hydrated flash for Tier 0, or accepted rehydration tax for lower tiers)
- An automation coverage plan (which recovery steps are automated vs manual, and what the manual steps cost in time)
- A drill schedule
From RTA (post-drill):
- A gap log: planned RTO vs measured RTA, per step
- A remediation backlog: which gaps are addressable through architecture changes vs process changes
- An updated RTO — because targets that have never been tested against RTA aren’t targets, they’re assumptions
If your DR plan doesn’t produce these outputs, it’s a compliance document. If it does, it’s an architecture foundation.
Tool: Model Your Recovery Costs Before the Event
Understanding your RPO and RTO targets is the first step. Knowing what meeting them costs — in storage, in replication infrastructure, and in recovery tooling — is the step that actually drives decisions.
Before you commit to a replication topology, model the restore cost. Enter your data volumes and target RTO to calculate cloud restore windows, egress costs, and whether your architecture actually delivers the recovery speed you need.
→ Model Your Restore CostWhere This Fits in the Data Protection Stack
This post sits upstream of everything else in the data protection pillar. RPO and RTO are the inputs. The rest of the architecture is the output.
Once your objectives are set and your workload tiers are classified:
If you’re building a full data protection practice — not just fixing a specific gap — the Data Protection & Resiliency Learning Path sequences every concept in order, from immutability fundamentals through recovery architecture and platform selection. It’s the right place to start if RPO, RTO, and RTA are inputs you’re defining for the first time.
For the broader architectural context this post sits within — platform comparisons, tooling decisions, and the full data protection stack — see the Data Protection Architecture pillar and the Disaster Recovery & Failover sub-pillar for the complete coverage map.
Frequently Asked Questions
Q: What is the difference between RPO and RTO?
A: RPO (Recovery Point Objective) defines how much data loss is acceptable — measured backwards from the failure point to your last good recovery point. RTO (Recovery Time Objective) defines how long the system can be offline — measured forwards from the failure event to confirmed service restoration. RPO drives backup frequency and replication architecture. RTO drives recovery infrastructure design and sequencing.
Q: What is RTA in disaster recovery?
A: RTA (Recovery Time Actual) is the real-world time your recovery actually took — measured from failure declaration to confirmed service restoration. It’s distinct from RTO, which is a target set in advance. The gap between RTO and RTA is what gets surfaced during recovery drills and post-mortems. Designing to close that gap — by addressing authentication dependencies, rehydration overhead, and human coordination latency — is a core architecture responsibility.
Q: How should RPO and RTO drive storage architecture decisions?
A: Each RPO tier maps to a specific replication mechanism: 24-hour RPO can be met with daily incremental backups; 1-hour RPO requires async replication; 15-minute RPO requires Continuous Data Protection or near-sync replication; near-zero RPO requires synchronous replication with an accepted write latency penalty. Each RTO tier maps to a recovery infrastructure design: aggressive RTOs require hydrated (non-deduplicated) flash landing zones, identity-isolated recovery systems, and automated recovery sequencing.
Q: Why does RTA often exceed RTO in practice?
A: The most common causes are: authentication dependencies on the failed production environment, undocumented application dependencies that stall recovery after the primary workload is restored, rehydration overhead on deduplicated storage that was not accounted for in the RTO calculation, human coordination latency between on-call teams, and outdated runbooks that don’t reflect current infrastructure. All of these are addressable through architecture and process design — but only if they’re treated as design inputs before the event.
Q: How often should recovery drills be run?
A: Drill cadence should match your RTO tier. Tier 0 workloads (sub-1-hour RTO) should be validated monthly. Tier 1 workloads (sub-4-hour RTO) should be validated quarterly. Lower tiers annually. Drills should be scoped to the full recovery sequence — not single-VM restore tests — and should measure RTA at each step to build a gap log against the stated RTO.
Additional Resources
Editorial Integrity & Security Protocol
This technical deep-dive adheres to the Rack2Cloud Deterministic Integrity Standard. All benchmarks and security audits are derived from zero-trust validation protocols within our isolated lab environments. No vendor influence.
R.M.
Senior Solutions Architect with 25+ years of experience in HCI, cloud strategy, and data resilience. As the lead behind Rack2Cloud, I focus on lab-verified guidance for complex enterprise transitions. View Credentials →
Get the Playbooks Vendors Won’t Publish
Field-tested blueprints for migration, HCI, sovereign infrastructure, and AI architecture. Real failure-mode analysis. No marketing filler. Delivered weekly.
Select your infrastructure paths. Receive field-tested blueprints direct to your inbox.
- > Virtualization & Migration Physics
- > Cloud Strategy & Egress Math
- > Data Protection & RTO Reality
- > AI Infrastructure & GPU Fabric
Zero spam. Includes The Dispatch weekly drop.
Need Architectural Guidance?
Unbiased infrastructure audit for your migration, cloud strategy, or HCI transition.
>_ Request Triage Session