VMware Licensing Costs: Why Most Estimates Are Wrong (And How to Fix Them)
You didn’t underestimate VMware licensing.
You underestimated how it’s calculated.
That distinction matters more than it sounds. The teams that get surprised by VMware renewal numbers aren’t making arithmetic errors. They’re modeling the wrong thing entirely — counting virtual machines when the invoice is counting physical cores, projecting year-one costs when the real exposure is in year three, and ignoring the footprint that exists purely to keep production alive.
The licensing model changed. Most cost models didn’t follow it. This post builds the framework that does.
Why Most VMware Estimates Are Wrong
The most common VMware cost modeling mistake isn’t a calculation error. It’s a framing error. Teams build their estimates around the workloads they’re running — the VMs, the applications, the resource consumption visible in vCenter dashboards. That was a reasonable model when VMware licensed per-socket with a perpetual purchase. It stopped being a reasonable model when Broadcom restructured everything around per-core subscriptions.
Under the old model, a two-socket server was two licenses regardless of how many cores were in each socket. A 16-core host and a 64-core host cost the same. That era is over. Under the current subscription model, every core in your licensed estate counts — and the minimum core requirements mean that underpopulated sockets don’t save you as much as you’d expect.
Four specific mistakes account for the majority of VMware cost estimate failures.
Modeling per-VM instead of per-core. VM count has no direct relationship to licensing cost. A single host with 64 cores running 10 VMs costs more to license than a host with 16 cores running 40 VMs. The hardware density determines the number, not the workload count.
Ignoring minimum core requirements. Broadcom’s per-core model includes minimums per CPU. If your CPUs have fewer than the minimum licensable cores, you pay for the minimum anyway. Environments built on lower-core-count CPUs for density efficiency discover this mismatch at renewal.
Missing add-on surface area. vSAN and NSX are not included by default at every tier. VVF includes vSAN up to a specific TiB entitlement — exceed it and the overage costs stack. NSX is a separate licensing conversation at many bundle levels. Aria (the rebranded vRealize suite) adds another layer. Each add-on was a separate line item under the old model. Under the new bundle structure, the included entitlements are defined and the overages are not.
Assuming previous pricing still applies. The pricing structure changed at acquisition, has continued to evolve since, and carries renewal escalation risk that perpetual licensing didn’t. The enterprises suing Broadcom over VMware licensing — AT&T, Tesco, Siemens, Fidelity — are not suing over minor discrepancies. The reported price increases range from 500% to over 1,000% against previous renewal expectations. Whatever your last renewal cost, that number is not a reliable baseline for the next one.
The VMware VCSP termination in early 2026 is the same dynamic playing out at the channel level: the commercial model is being restructured in ways that systematically produce cost surprises for customers who are modeling against the old rules.
What You’re Actually Paying For
Understanding what the invoice actually represents requires separating three structural elements of the current VMware licensing model: the core-based subscription, the bundle tier, and the add-on layer.
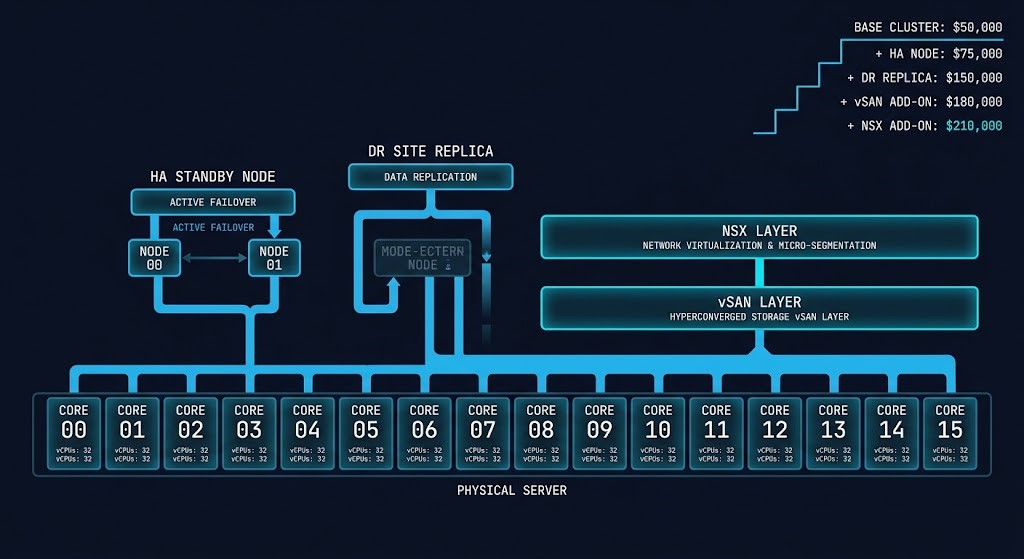
Core-based licensing is the foundation. Every physical core in every host running VMware software is a licensed unit. This is not a per-VM charge, not a per-socket charge, and not a consumption-based charge. You pay for the cores that exist in the hardware, not the cores that are actively doing work at any given moment. The implication is significant: a host running at 20% average utilization costs exactly the same to license as a host running at 95%.
The minimum core requirements add a floor to this model. If a CPU has fewer physical cores than the per-CPU minimum, the minimum applies. For environments built around lower-core-count CPUs — common in certain HCI configurations or legacy hardware — this floor effect can represent a meaningful gap between what you thought you’d pay and what you actually owe.
The subscription model replaces the perpetual license and annual support renewal pattern that enterprise teams operated under for two decades. Instead of a capital purchase with predictable annual support costs, you have a recurring subscription with renewal risk at each cycle. The practical difference is that perpetual licenses, once purchased, were yours at a fixed cost basis. Subscription renewals are repriced at each cycle — and Broadcom has demonstrated clearly that repricing will not trend favorably for customers.
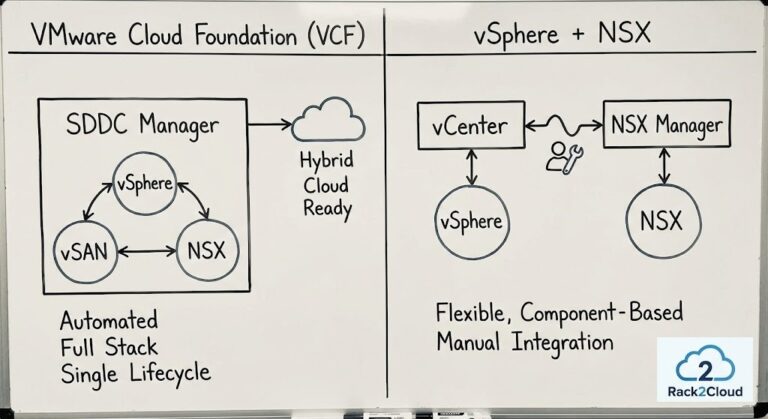
Bundle tiers (VVF and VCF) determine what’s included. VMware vSphere Foundation (VVF) is the entry point: vSphere, vCenter, and vSAN up to a defined TiB capacity per core. VMware Cloud Foundation (VCF) is the full stack: VVF plus NSX, plus additional management capabilities. The bundled model eliminates the à la carte flexibility that previously allowed architects to license only what they used. You are choosing a bundle tier, and the bundle tier defines both what you get and what you pay — including capabilities you may not deploy. For a precise breakdown of VVF vs VCF cost crossover points relative to your specific hardware density, the VMware Core Calculator models the socket-to-core ratios and vSAN TiB entitlements against your actual cluster footprint.
The shift from à la carte to bundle tiers is not neutral. Teams whose environments map cleanly to a single bundle tier benefit from the simplified structure. Teams whose environments partially overlap two tiers — needing NSX for some workloads but not all, for example — end up licensing the full higher tier to cover the partial use case.
The Hidden Cost Multipliers
This is where VMware cost estimates most consistently fail — not in the core count, but in the footprint that exists around the workloads that are actually running. The principle is straightforward and deserves to be stated plainly: you don’t pay for what you use. You pay for what you provision.
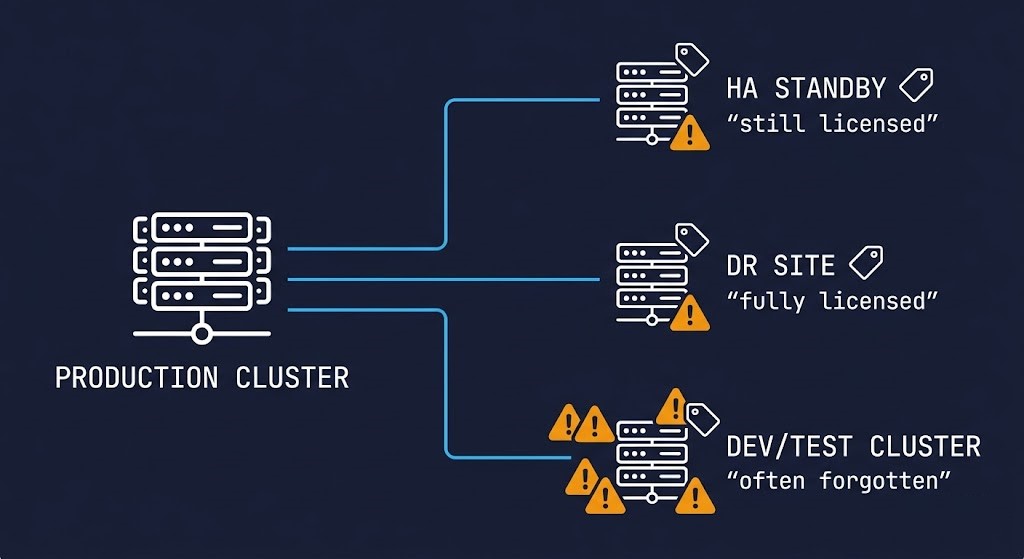
Every licensed core in your environment contributes to the bill, regardless of whether it’s actively running a production workload at any given moment. Understanding where those cores actually live — not just in production clusters, but across the full operational footprint — is the difference between an estimate and a surprise.
Overprovisioned clusters and zombie resources. VMware environments accumulate unused capacity over time. Dev/test VMs that were spun up and never decommissioned. Hosts brought in for a project that concluded. Snapshot chains that grew unchecked until they represent a significant portion of the cluster’s storage profile. These don’t reduce your licensing costs — they contribute to them. Every core on those hosts is licensed. The snapshot tax that accumulates in neglected VMware environments doesn’t just create migration complexity; it creates licensing surface area you’re paying for and not using productively.
HA and failover capacity. vSphere HA requires reserved capacity across the cluster to guarantee that workloads can restart if a host fails. The standard HA configuration reserves enough capacity to absorb at least one host failure — meaning that in a four-node cluster, roughly one node’s worth of compute is reserved for failover. Those cores are licensed at full cost. The fact that HA capacity sits idle under normal conditions doesn’t make it optional; it makes it a licensing cost that doesn’t map to any active workload.
DR environments. Disaster recovery environments are one of the most consistently underestimated VMware cost inputs. A DR site running vSphere — even if it’s cold standby, even if the VMs are powered off — still has licensed cores in licensed hosts. For environments with a full DR footprint, this can represent a doubling of the core count relative to production alone. Teams that have modeled their licensing costs against production infrastructure only discover this at renewal when the DR site’s full core count appears on the invoice.
Add-on exposure. vSAN storage overages above the VVF TiB entitlement accrue additional costs that are genuinely difficult to predict without monitoring your storage-to-core ratio over time. NSX, if deployed, either pushes the full estate to VCF pricing or introduces a separate NSX licensing conversation depending on your bundle tier. Aria (vRealize Operations and its siblings) adds another licensing layer if operational tooling is in scope. The Broadcom Year Two analysis covers how density mismatches between compute and storage generate licensing exposure that didn’t exist under the old model — the VCF crossover point is not where most teams assume it is.
Support and subscription tiers. Production support for VMware is not a flat cost. The support tier attached to your subscription determines response SLAs, access to patches and updates, and the terms under which security fixes are delivered. Downgrading support to reduce costs introduces operational risk. The cost is real and belongs in the total model.
The cumulative effect of these multipliers is that most VMware environments carry a licensed core footprint that is 40–70% larger than the production cluster core count alone. A team modeling licensing against their production host inventory is pricing against roughly half to two-thirds of what the invoice will reflect.
The Estimation Framework
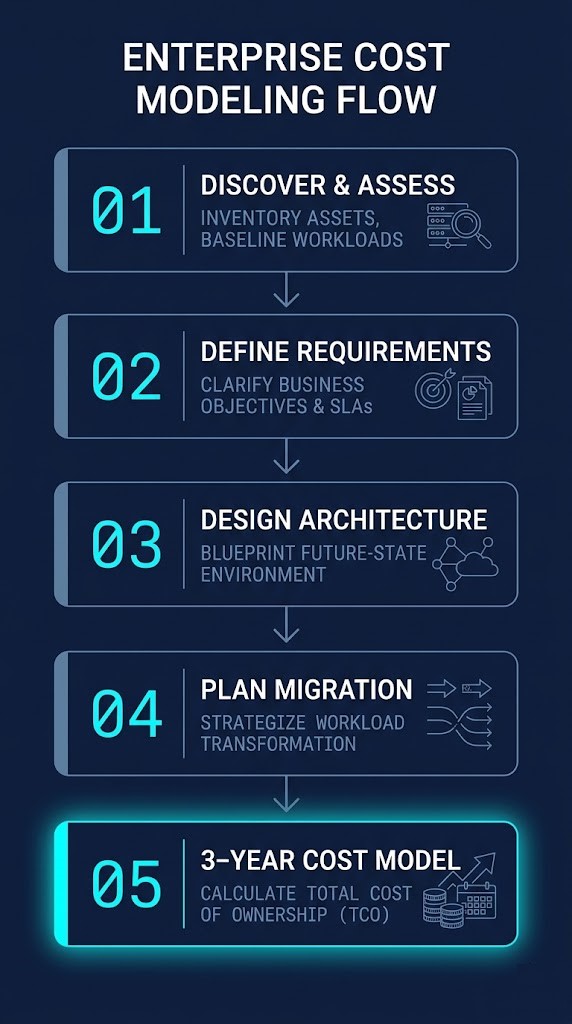
Accurate VMware cost modeling follows a five-step sequence. The steps are not complex individually — the failure mode is skipping them or stopping at step two.
Step 1 — Inventory actual cores, not VMs. The starting point is a physical core count across every host in the licensed estate. Not VM count. Not vCPU count. Physical cores on physical CPUs in physical hosts running VMware software. PowerCLI can produce this reliably. Manual inventory works for smaller environments. The point is that nothing downstream is valid until this number is accurate.
Step 2 — Apply minimum core requirements per CPU. Once you have the physical core count, apply the minimum core licensing floor to each CPU. If any CPUs have fewer physical cores than the per-CPU minimum, replace the actual count with the minimum for licensing purposes. This is where dense-per-socket configurations with lower core counts often produce unexpected results.
Step 3 — Include HA and failover capacity. Add the cores from nodes reserved for HA failover to the licensed footprint. If the cluster is sized for N+1 host failure tolerance, those standby node cores are licensed. If vSphere HA is configured with a percentage-based reservation, calculate the equivalent core count and include it.
Step 4 — Include DR and non-production environments. Add every host in every VMware environment that runs licensed software — DR sites, staging, dev/test clusters, management clusters. Each contributes licensed cores regardless of utilization or workload criticality.
Step 5 — Model the three-year cost, not year one. Year-one cost is not the number that matters for budget planning. The subscription renews, and it renews at Broadcom’s pricing at the time of renewal. Model year two and year three with a conservative renewal escalation assumption. The enterprises currently in litigation over VMware pricing were not surprised by year-one costs — they were surprised by what happened at renewal. The first quote isn’t the problem. The second one is.
Use the framework above to build the manual model first — it forces clarity about what’s actually in the licensed footprint. The Core Calculator then extends that model to the VVF vs VCF crossover analysis and vSAN TiB entitlement exposure.
Quick Estimate: Three-Year VMware Cost Model
The calculator below is a starting point — not a substitute for the full PowerCLI audit, but enough to surface whether your current renewal trajectory warrants immediate attention.
Cost Reference: What Scenarios Actually Look Like
The table below reflects three representative environments modeled through the five-step framework. Costs are illustrative — actual pricing requires a Broadcom quote — but the ratios and scaling behavior are representative.
| Scenario | Hosts | Cores/Host | HA Nodes | DR Site | Add-ons | Est. Year 1 | Est. Year 3 |
|---|---|---|---|---|---|---|---|
| Small Production — no DR | 3 | 32 | 1 node reserved | No | None | Baseline | +18–24% |
| Mid-Size with vSAN + NSX | 6 | 64 | 1 node reserved | No | vSAN overage, NSX | 2.8–3.4× baseline | +30–40% Y3 |
| Full Enterprise + DR | 12 | 64 | 2 nodes reserved | Yes (6 hosts) | vSAN, NSX, Aria | 5–6× baseline | Renewal risk significant |
The scaling behavior in the table is the point. The move from small production to full enterprise with DR is not a linear cost increase — it is exponential, driven by the interaction between core-based pricing, HA reservation, and full DR footprint licensing.
Quick estimate formula:
Total Licensed Cores = (Production Cores) + (HA Reserved Cores) + (DR Site Cores) + (Non-Prod Cores)
Year 1 Cost ≈ Total Licensed Cores × Per-Core Rate + Add-On Overages + Support Tier
Year 3 Cost ≈ Year 1 Cost × (1 + renewal escalation)²
The per-core rate and renewal escalation factor require a current Broadcom quote — both have changed since acquisition and continue to be adjusted. What the formula makes visible is the structure: the licensed core total is the primary driver, and the renewal multiplier compounds against that total, not against a stable baseline.
Where Teams Get Burned
Cost modeling failure has a predictable sequence. Understanding each stage is as useful as the framework itself.
Renewal shock. The most common burn. An organization renews VMware for the first time under the subscription model and discovers that the number bears little resemblance to historical renewal costs. The licensing structure changed, the bundle tier forced capability inclusions that weren’t previously licensed, and the per-core model applied to the full provisioned footprint rather than the workload footprint. None of this was hidden — but none of it was in the spreadsheet that was used to budget the renewal.
The second renewal is often worse. Year one pricing sometimes includes transition accommodations or negotiated terms. Year two is the market rate. Year three is the market rate after escalation. Organizations that didn’t build the three-year model at year one are building it under pressure at year two.
License audit exposure. Broadcom’s audit posture is stricter than VMware’s was. Under the old model, licensing compliance was enforced with some flexibility — grace periods, informal accommodations for transient over-deployment. Under the subscription model, the licensed core count is a contractual commitment and audits enforce it as such. Environments with undocumented hosts, shadow dev/test clusters, or management infrastructure that was never formally included in the licensing inventory carry audit risk that translates directly into retroactive licensing cost exposure.
Scaling events. Under socket-based perpetual licensing, adding a new host to a cluster had a defined, predictable cost. Under per-core subscription, adding a host means adding those cores to the licensed footprint at the current per-core rate, immediately, across the remaining subscription term. Organizations in growth phases discover that the cost scaling behavior of the subscription model doesn’t reward density efficiency the way the old model did. Every hardware refresh is a licensing event.
Vendor lock-in compounding renewal pressure. VMware environments accumulate dependencies over time — vSAN storage policies, NSX micro-segmentation rules, vCenter automation hooks, SRM failover configurations. The deeper these integrations go, the more painful an exit becomes. Broadcom understands this. The renewal pricing reflects it. Organizations with deep VMware integration dependency are in a structurally weaker negotiating position at every renewal cycle. The Post-Broadcom Series documents what unwinding that dependency actually requires across five execution layers.
Architecture Implications
VMware licensing is not just a cost input. It is an architectural constraint that shapes decisions about cluster design, hardware selection, consolidation strategy, and migration timing. Teams that treat it purely as a finance problem discover the architectural implications later — usually at renewal.
Cluster sizing decisions carry licensing consequences. The instinct to add hosts for headroom, to over-provision for peak load, or to maintain generous HA reservation — all of it creates licensed core footprint. The architect who designs the cluster and the procurement team that models the licensing cost need to be working from the same numbers. An HA policy that reserves 25% of cluster capacity is not just a resilience decision; it is a licensing decision.
Consolidation vs. distribution trade-offs have changed. Under socket-based licensing, consolidating workloads onto fewer, denser hosts reduced license count. Under per-core licensing, a denser host with more cores doesn’t necessarily reduce the licensed footprint — it may increase it if the core count per socket is higher than previous hardware. The consolidation calculus that was valid under the old model needs to be re-run against the current one.
The migration decision is partly a licensing decision. For organizations evaluating whether to stay on VMware, migrate to an alternative hypervisor, or move workloads to cloud, the licensing cost model is a significant input to the exit analysis. Proxmox vs VMware migration and the cloud repatriation calculus both ultimately require a defensible VMware cost model on one side of the ledger. If that model is wrong, the exit analysis built on it is wrong.
Once the cost model makes migration compelling, the HCI Migration Advisor is the natural next step — pre-flight checks against actual hardware before any workload moves.
Architect’s Verdict
VMware licensing isn’t expensive because of the per-core price. It’s expensive because of how the model scales against the infrastructure decisions that enterprise environments have been making for years — HA reservations, DR footprints, non-production clusters, and add-on deployments that were never modeled as licensing surface area. The price per core is visible. The total licensed footprint usually isn’t, until renewal surfaces it.
The shift from perpetual to subscription didn’t just change the payment model. It changed the risk profile. A perpetual license, once purchased, carried no renewal pricing risk. A subscription renews at market rate — a market rate that Broadcom controls and has demonstrated a clear willingness to increase. The three-year cost model is not pessimism. It is the minimum planning horizon for any infrastructure decision in this environment.
Model the full footprint. Include every non-production environment. Run the three-year projection before the renewal conversation starts. The organizations currently in litigation over VMware costs are not there because Broadcom surprised them. They’re there because the cost model they were working from didn’t reflect the infrastructure reality Broadcom was licensed against. Build the model that matches the environment, and the renewal number stops being a surprise.
Additional Resources
Editorial Integrity & Security Protocol
This technical deep-dive adheres to the Rack2Cloud Deterministic Integrity Standard. All benchmarks and security audits are derived from zero-trust validation protocols within our isolated lab environments. No vendor influence.
R.M.
Senior Solutions Architect with 25+ years of experience in HCI, cloud strategy, and data resilience. As the lead behind Rack2Cloud, I focus on lab-verified guidance for complex enterprise transitions. View Credentials →
Get the Playbooks Vendors Won’t Publish
Field-tested blueprints for migration, HCI, sovereign infrastructure, and AI architecture. Real failure-mode analysis. No marketing filler. Delivered weekly.
Select your infrastructure paths. Receive field-tested blueprints direct to your inbox.
- > Virtualization & Migration Physics
- > Cloud Strategy & Egress Math
- > Data Protection & RTO Reality
- > AI Infrastructure & GPU Fabric
Zero spam. Includes The Dispatch weekly drop.
Need Architectural Guidance?
Unbiased infrastructure audit for your migration, cloud strategy, or HCI transition.
>_ Request Triage Session