Resource Pooling Physics: Mastering CPU Wait Time and Memory Ballooning in High-Density Clusters
I’ve spent 25 years watching infrastructure fail, and here’s what I’ve learned: most outages don’t kick off with a dramatic meltdown. They creep in quietly. A bit of scheduler pressure, memory ballooning quietly reclaiming guest pages, and no one’s dashboard even notices
Your CPU looks fine at 40%. There’s a 30% buffer left on memory. Still, the helpdesk queue keeps growing with complaints about “sluggish” apps. Tail latencies shoot up. Recovery windows stretch beyond acceptable bounds. This isn’t a mystery — it’s physics.
This is Part 1 of the Resource Pooling series. For the escalation sequence that follows — how ballooning leads to compression, and compression leads to swap failure — see Part 2: The Physics of Memory Overcommit. For the scheduler contention diagnostics that underpin everything in this guide, the companion post is CPU Ready vs CPU Wait: Why Your Cluster Looks Fine but Feels Slow.
To understand where these problems fit in the broader virtualization architecture decision, start with the Modern Virtualization Learning Path.
The Illusion of Utilization
Your dashboard says “CPU: 40%.” Your users say “The app is frozen.” Both are true.
In high-density HCI environments, utilization is a vanity metric. Contention is the reality. When a VM freezes for 500ms, it isn’t because the CPU is full — it’s because the scheduler hasn’t given it a turn on the physical core yet.
This Wait Time — %RDY in vSphere, %st in Linux — is the silent killer of transactional databases and real-time AI inference. The gap between what your dashboard reports and what your users experience is the entire subject of this guide.
| Metric | What It Measures | Why It Matters |
| Run Queue Depth | How many processes are waiting for CPU | Shows scheduler congestion — the real bottleneck. |
| Memory Reclaim Rate | How often memory is forcibly taken | Indicates ballooning, swapping, or working set eviction. |
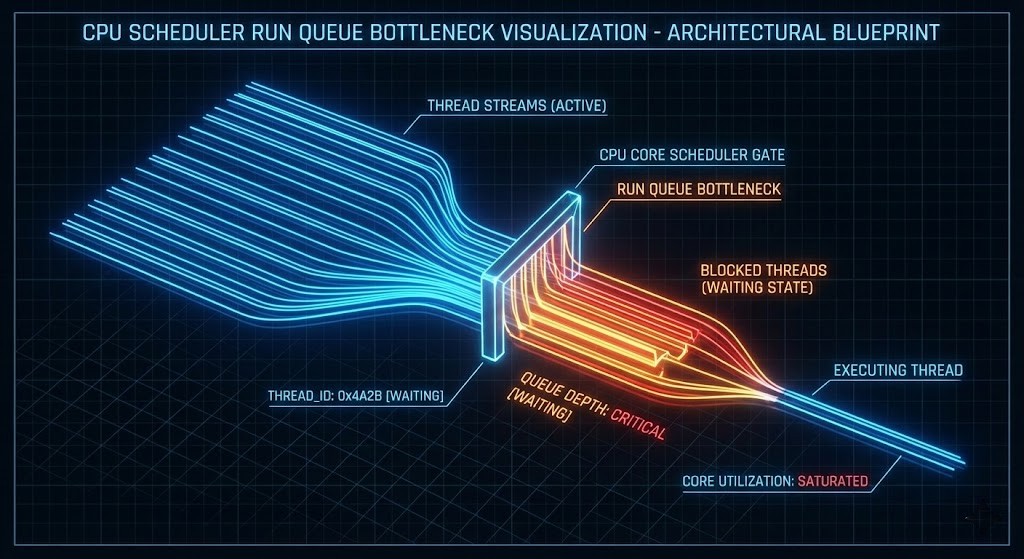
CPU Scheduling Physics: When Cores Lie
The Run Queue Reality
The run queue is the line of processes waiting for CPU cycles. If you have 32 physical cores and a run queue consistently above 32, latency inflation is guaranteed — regardless of whether utilization reads 50%.
This happens under three conditions:
- Oversubscription: Too many vCPUs stacked on the host — the scheduler cannot service all requests within the latency window
- Broken NUMA: The scheduler is crossing socket boundaries to find local memory, adding interconnect latency to every memory access
- Noisy Neighbors: Control plane and data plane workloads competing for the same physical cores
Architectural Design Rule: Never mix Control Plane (latency-sensitive) with Batch or AI workloads. They have opposing scheduling needs — one requires consistent sub-millisecond response, the other wants to consume every available cycle in bursts. This is the same isolation principle that governs CVM resource reservation on Nutanix AHV — covered in depth in the Day-2 Operations: Nutanix AHV guide.
For the full diagnostic methodology — esxtop commands, AHV scheduler flags, and the exact thresholds that indicate contention vs saturation — see CPU Ready vs CPU Wait: The Real Noisy Neighbor Metrics.
Memory Ballooning: Controlled Starvation and the Feedback Loop
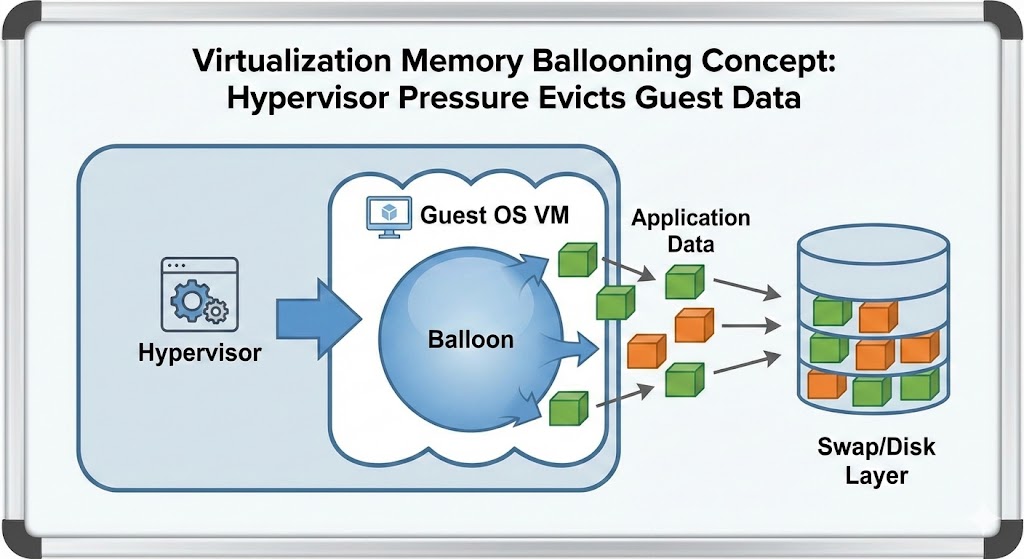
Memory ballooning is not an optimization feature. It is forced eviction.
When the host hits memory pressure, it instructs the guest OS to inflate the balloon driver — claiming pages from the guest to return to the host. The guest OS responds by dropping cache or swapping to disk to satisfy the request. The host gets its memory back. The guest’s performance collapses.
Why ballooning destroys performance:
- It’s invisible: Unlike swap, ballooning often doesn’t trigger standard alerts until it’s too late — dashboards show normal memory utilization at the host level while guests are thrashing
- It destroys caching: The first thing a guest OS dumps is the filesystem cache — the exact layer keeping I/O performance acceptable
- The feedback loop: Guest drops cache → disk reads increase → I/O wait rises → CPU wait rises → scheduler pressure increases → run queue grows → users report frozen applications
If you are seeing ballooning during a migration, stop immediately. Consult the vSphere to AHV Migration Strategy to resize your target containers before the source environment destabilizes. Migrating into an already-pressured cluster amplifies every one of these failure modes.
For the complete escalation sequence — how ballooning leads to transparent page sharing exhaustion, then compression, then swap failure — see Resource Pooling Part 2: The Physics of Memory Overcommit.
NUMA Locality: The Hidden Tax
High-density clusters are where NUMA locality goes to die. If a VM’s vCPU is on Socket 0 but its memory pages are on Socket 1, every memory access must traverse the interconnect — QPI, UPI, or AMD Infinity Fabric depending on your hardware generation.
Result: Memory latency doubles.
Symptom: “Random” application slowness during peak hours that correlates with VM density increases, not hardware failures.
Diagnosis: NUMA drift isn’t a tuning issue — it’s an architectural density failure that requires workload placement policy, not reactive remediation.
The storage-layer equivalent of NUMA collapse — where read I/O crosses node boundaries instead of serving from local flash — is the same phenomenon measured in the Nutanix AHV vs vSAN 8 ESA Saturation Benchmark. Data locality is not just a storage concept — it governs CPU, memory, and storage simultaneously.
The Scheduler Health Toolkit
If you can’t see run queues and ballooning in real-time, you’re managing by dashboard fiction. Here is how to check for the physics of failure across platforms.
For engineers who want to test these diagnostic commands against a lab cluster before running them in production, a DigitalOcean Droplet provides a safe environment to validate the toolkit — particularly the PSI pressure commands and vmstat baselines — before running them against production hosts.
1. Platform-Agnostic Quick Checks (Linux Hosts)
CPU Scheduler Health
Bash
uptime
vmstat 1 5
- Watch
r: If run queue > core count, you are saturated. - Watch
st: Steal time > 0 means the host is starving you.
Memory Pressure
Bash
cat /proc/meminfo | egrep 'MemFree|MemAvailable|Buffers|Cached'
- Red Flag: If
MemAvailableis collapsing whileBuffers/Cachedis near zero, you are thrashing.
2. Nutanix AHV / KVM
Bash
virsh list --all
virsh domstats <vm-name> --balloon
- Red Flag: Any balloon target different from current allocation implies reclaim is active.
3. VMware ESXi (The Classic)
Run esxtop in the shell.
- %RDY (Ready): > 5% means scheduler contention.
- %CSTP (Co-Stop): > 3% means you have too many vCPUs (SMP scheduling collapse).
- MEMCTL: > 0 means ballooning is active.
For the complete esxtop diagnostic workflow — including co-stop interpretation and per-VM ready time analysis — see CPU Ready vs CPU Wait.
4. Kubernetes Nodes
Check Pressure Stall Information (PSI)—this is the modern way to see contention.
Bash
cat /proc/pressure/cpu
cat /proc/pressure/memory
- Red Flag: Any
someorfullvalue > 0 indicates processes are stalling due to resource contention — the kernel-level equivalent of CPU ready time.
Prometheus Alert Rules
Don’t wait for the phone to ring. Alert on the physics — not the symptoms.
CPU Scheduler Saturation
YAML
- alert: SchedulerRunQueueSaturation
  expr: node_load1 / count(node_cpu_seconds_total) > 1
  for: 2m
  labels:
    severity: warning
  annotations:
    summary: "Run queue exceeds core count: Scheduler saturation detected"
Memory Reclaim / Ballooning
YAML
- alert: MemoryPressureDetected
  expr: node_memory_MemAvailable_bytes / node_memory_MemTotal_bytes < 0.15
  for: 2m
  labels:
    severity: critical
  annotations:
    summary: "Available Memory < 15%: Critical Risk of Ballooning"
These alert rules are the observability layer for the architectural design rules below. Embed them in your Terraform modules so they deploy with every new cluster — not as an afterthought after the first 3 AM incident. The framework for doing this is in the Modern Infrastructure & IaC Learning Path.
Architectural Design Rules (Non-Negotiable)
These rules are non-negotiable. If you’re not enforcing them with code, you’re enforcing them with incidents.
- Separate Resource Pools: Never mix Control Plane (latency-sensitive) with Batch or AI workloads — opposing scheduling needs guarantee interference
- Enforce Hard Memory Floors: Use reservations for production workloads. Disable ballooning for databases. Treat swap as a failure state, not a safety net. Memory ballooning in production databases is not a tuning problem — it is an architectural failure that requires reservation enforcement, not reactive remediation.
- Cap vCPU Oversubscription:
- Stateful workloads: 1.5:1 maximum
- Stateless workloads: 4:1 maximum
- AI/Batch: Dedicated (1:1)
Anything beyond these ratios is gambling with scheduler determinism. The house always wins eventually.
Before applying these ratios to a migration target, validate that your destination cluster has the physical headroom to honor them. Migrating 200 VMs with correct oversubscription ratios into a cluster that’s already at 70% utilization creates the same failure modes you’re trying to prevent.
Architect’s Verdict
Utilization is a statistic. Contention is physics.
Architecture must obey physics, or you will be punished by it. If you want deterministic performance, you must engineer deterministic scheduling. Everything else is observability theater — dashboards that look green while users file tickets.
For the complete framework — from scheduling physics through memory overcommit through IaC-enforced resource governance — the Modern Infrastructure & IaC Learning Path covers the full progression. For the storage-layer performance physics that compound these scheduler problems under VDI and database workloads, see the HCI Architecture Learning Path.
Additional Resources
Editorial Integrity & Security Protocol
This technical deep-dive adheres to the Rack2Cloud Deterministic Integrity Standard. All benchmarks and security audits are derived from zero-trust validation protocols within our isolated lab environments. No vendor influence.
R.M.
Senior Solutions Architect with 25+ years of experience in HCI, cloud strategy, and data resilience. As the lead behind Rack2Cloud, I focus on lab-verified guidance for complex enterprise transitions. View Credentials →
Get the Playbooks Vendors Won’t Publish
Field-tested blueprints for migration, HCI, sovereign infrastructure, and AI architecture. Real failure-mode analysis. No marketing filler. Delivered weekly.
Select your infrastructure paths. Receive field-tested blueprints direct to your inbox.
- > Virtualization & Migration Physics
- > Cloud Strategy & Egress Math
- > Data Protection & RTO Reality
- > AI Infrastructure & GPU Fabric
Zero spam. Includes The Dispatch weekly drop.
Need Architectural Guidance?
Unbiased infrastructure audit for your migration, cloud strategy, or HCI transition.
>_ Request Triage Session