AI Fabric Pressure Analyzer
Model east-west pressure, synchronization overhead, and fabric saturation risk before they constrain your GPU investment.
GPU utilization can remain low while fabric saturation is already occurring.
That’s the architectural blind spot the AI Fabric Pressure Analyzer surfaces. Standard AI infrastructure monitoring tools expose compute throughput, memory bandwidth, and GPU utilization. None of them expose east-west communication pressure — the fabric-layer bottleneck that accumulates invisibly while compute metrics appear healthy. By the time GPU utilization drops in response to fabric throttling, the constraint has already been active for minutes or hours.
This is the Fabric Pressure Illusion: the condition where accelerator utilization appears healthy while east-west communication pressure is approaching fabric saturation. The degradation is real. The telemetry doesn’t show it.
The AI Fabric Pressure Analyzer models the relationship between cluster topology, fabric configuration, parallelism strategy, and synchronization overhead to surface saturation risk before it compounds with scale. It is not a bandwidth calculator. It is not a network monitoring dashboard. It is a deterministic pressure model — input your cluster parameters, get a named pressure profile and a saturation trigger point.
Framework — Fabric Pressure Illusion
The condition where accelerator utilization appears healthy while east-west communication pressure is approaching fabric saturation — creating hidden performance degradation not visible through compute telemetry alone.
What the AI Fabric Pressure Analyzer Models
01 — Cluster Configuration
GPU count, node count, and derived GPUs-per-node ratio. The cluster topology is the primary determinant of east-west communication demand — more nodes means more all-reduce surface area.
02 — Fabric Configuration
Network speed (100G / 200G / 400G / 800G), fabric type (Ethernet / RoCE / InfiniBand), and oversubscription ratio (1:1 through 4:1). Oversubscription is the most commonly underestimated pressure multiplier in AI fabric design — each topology tier compounds non-linearly under scale.
03 — Workload Profile
Parallelism strategy (Data / Tensor / Pipeline / Hybrid), model size, global batch size, and gradient sync frequency. Parallelism strategy is the single input that most changes the pressure profile — data-parallel all-reduce generates maximum east-west load; tensor-parallel concentrates pressure intra-node.
04 — Scale Projection
Optional target node count for Saturation Trigger Point calculation. Where are you scaling to? The analyzer projects congestion onset and throughput loss at target scale — not just current state.
Output Signals
Six named signals. The primary output is the East-West Pressure Index — a 0–100 composite score reflecting aggregate fabric stress from communication demand, oversubscription topology, and workload synchronization profile. The remaining signals break that score into actionable components.
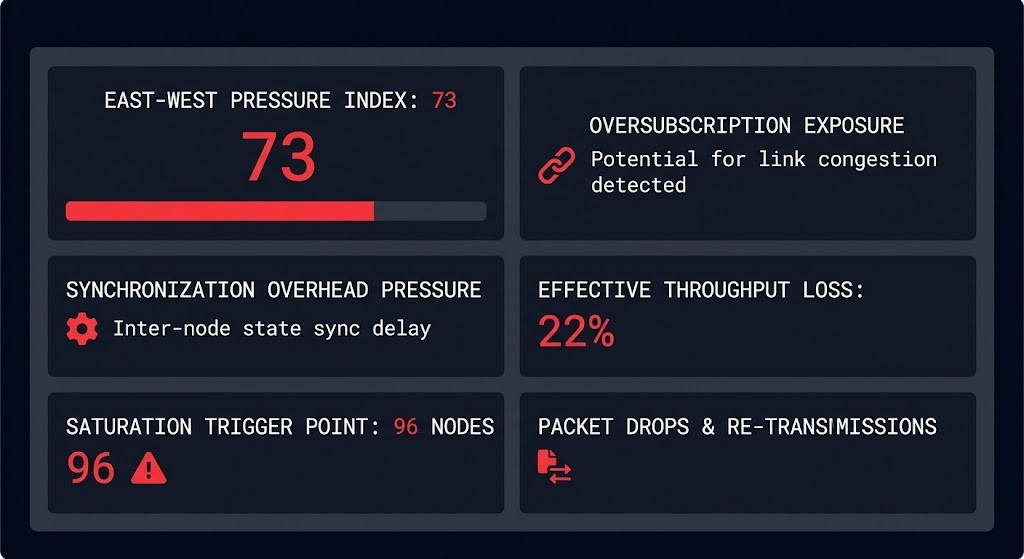
East-West Pressure Index — Primary
0–100 composite score with scored bar. Aggregate fabric stress from all input dimensions. Drives the Fabric Saturation Risk tier classification: Low / Moderate / High / Critical.
Oversubscription Exposure
Topology contribution to congestion overhead. Surfaces how much of the pressure score derives from oversubscription ratio rather than raw demand — an architectural variable that can be changed before scaling.
Synchronization Overhead Pressure
All-reduce and gradient synchronization burden. Distinguishes fabric-constrained throughput loss from synchronization-constrained throughput loss — the remediation path differs for each.
Effective Throughput Loss
Estimated percentage degradation from fabric overhead at current configuration. Not peak throughput loss — effective operating throughput loss at steady-state training or inference load.
Saturation Trigger Point
Two outputs in one: projected node count at congestion onset, and estimated throughput loss at target scale. The question this answers is not “am I saturated now?” It is “where does saturation begin, and what does it cost at my target configuration?”
Fabric Archetypes
The analyzer classifies every configuration into one of seven named archetypes. Each archetype describes a structural condition, not a severity label. The archetype drives the escalation path — the remediation logic differs substantially between a Collective Communication Bound cluster and a Fabric Saturated one, even when their pressure index scores are similar.
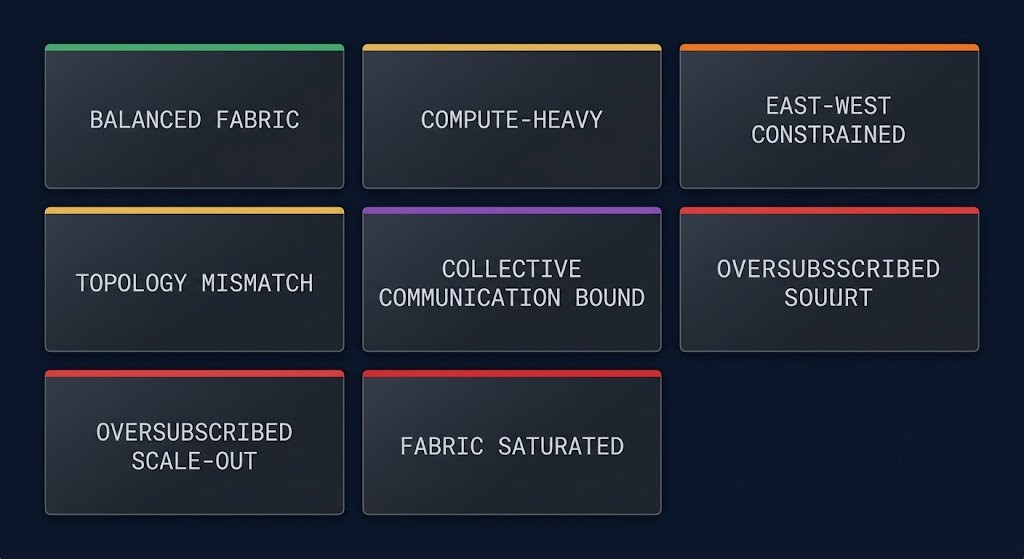
Healthy east-west headroom relative to workload demand. Monitor as cluster scales — this profile typically degrades non-linearly past the saturation trigger threshold.
GPU density is outpacing fabric capacity. Scaling nodes will accelerate fabric pressure faster than compute gains. Network investment should precede GPU expansion.
Communication pressure is growing faster than compute utilization signals suggest. The east-west bottleneck is not yet visible in GPU utilization metrics — the Fabric Pressure Illusion is active.
Fabric design is mismatched to the current workload profile. Pressure appears under specific traffic patterns rather than uniformly. Validate topology against workload communication patterns before scaling.
Training is dominated by synchronization overhead. Reducing gradient sync frequency, increasing local batch accumulation, or switching to gradient compression will have more impact than fabric upgrades at this stage.
Expansion is increasing congestion faster than usable throughput. Each additional node adds more east-west demand than the oversubscribed fabric can absorb. Re-evaluate topology before scaling further.
Network is the dominant performance bottleneck. GPU utilization appears moderate while east-west saturation is actively throttling throughput. Scale network before adding GPUs.
Where the Fabric Layer Fits
The AI Fabric Pressure Analyzer occupies the Fabric plane in the AI Infrastructure operational stack — between storage throughput and runtime saturation. Fabric pressure is not visible at the compute layer or the runtime layer. It lives between them.
AI Infrastructure Operational Stack
AI Fabric Pressure Analyzer: Key Features
- Deterministic fabric pressure scoring: East-West Pressure Index derived from cluster topology, fabric configuration, parallelism strategy, and synchronization profile — no inference, no sampling.
- Parallelism-aware modeling: Data parallel, tensor parallel, pipeline parallel, and hybrid strategies produce distinct pressure profiles — the analyzer treats each differently, not as a single “AI workload” category.
- Seven named fabric archetypes: Each archetype describes a structural condition and drives a specific escalation path. Collective Communication Bound and Fabric Saturated clusters require different interventions even at similar pressure scores.
- Saturation Trigger Point: Projects the node count at which congestion onset occurs and estimates throughput loss at target scale — answers the scale planning question, not just the current-state question.
- Client-Side Only: No data leaves the browser. No telemetry, no server-side logging, no account required.
THE ANALYZER SURFACES THE SATURATION POINT.
A REVIEW MOVES THE THRESHOLD.
The saturation trigger point names where fabric pressure begins constraining throughput under your current topology. A fabric architecture review maps it to your real cluster scale, parallelism strategy, and expansion roadmap — and identifies the topology changes that move the threshold before you add more GPUs.
|
>_ Architectural Guidance
Infrastructure Architecture ReviewStructured review of your AI fabric architecture and east-west pressure profile against real cluster topology, communication patterns, and scale objectives.
|
>_ The Dispatch
Architecture Playbooks. Field-Tested Blueprints.AI fabric architecture, east-west pressure patterns, and GPU cluster scaling — delivered as field-tested operational blueprints.
Zero spam. Unsubscribe anytime. |
Frequently Asked Questions
Q: What does the AI Fabric Pressure Analyzer actually measure?
A: The analyzer models east-west communication pressure — the aggregate fabric demand generated by gradient synchronization, all-reduce operations, and inter-node data movement in AI training and inference clusters. The primary output is the East-West Pressure Index (0–100), which reflects fabric stress from cluster topology, oversubscription ratio, parallelism strategy, and sync frequency. It surfaces the Fabric Pressure Illusion: the condition where GPU utilization appears healthy while fabric saturation is already constraining throughput.
Q: How is this different from a network monitoring tool or bandwidth calculator?
A: Network monitoring tools show current utilization against capacity. Bandwidth calculators show raw throughput requirements. The AI Fabric Pressure Analyzer models pressure dynamics — how oversubscription compounds under scale, how parallelism strategy changes the communication profile, where the saturation trigger point is for a specific cluster topology. It is a pre-build and scale-planning tool, not a post-deployment observation tool. You don’t need a running cluster to use it.
Q: Which cluster configurations and workload types does the analyzer cover?
A: The analyzer covers data parallel, tensor parallel, pipeline parallel, and hybrid parallelism strategies across Ethernet, RoCE, and InfiniBand fabrics at 100G through 800G speeds. Oversubscription ratios from 1:1 through 4:1 are modeled. It is designed for AI training clusters and inference fleet sizing, not general-purpose HPC or storage network analysis.
Q: Is any data sent to a server or stored?
A: No. The analyzer runs entirely in your browser session. No inputs are transmitted, logged, or stored. No account is required. The application is a single HTML file with no backend dependencies.
🔒 Privacy Architecture: No cookies. No tracking pixels. No server-side database.
This logic runs entirely in your local browser session.