containerd in Production: 5 Day-2 Failure Patterns at High Pod Density
Your containerd metrics look healthy.
Pod density is climbing. Node CPU is stable. Memory pressure is low.
Then somewhere around 800–900 containers per node, something quiet happens:
containerd-shim processes begin accumulating memory. Each failure signature maps directly to the diagnostic loops in the Rack2Cloud Kubernetes Day-2 Method. For environments running a service mesh alongside containerd, the shim tax and socket saturation patterns interact directly with sidecar proxy overhead — the Service Mesh Architecture pillar covers how to model the combined per-pod cost of shim + sidecar before committing to a mesh deployment.
4 GB. 6 GB.
Eventually the Linux OOM killer steps in and starts terminating containers that Kubernetes never asked it to kill.
Your dashboards still say the node is healthy.
Your workloads disagree.
This is the Day-2 reality of containerd in production at scale. Not a configuration error. Not a software bug. A set of predictable failure patterns that appear after your cluster reaches the density thresholds that most documentation never discusses.
These patterns were observed across containerd in production Kubernetes environments running 400–1,000 containers per node. They are not edge cases. They are the rule.
The containerd in Production Runtime Stack: What Actually Runs Your Containers
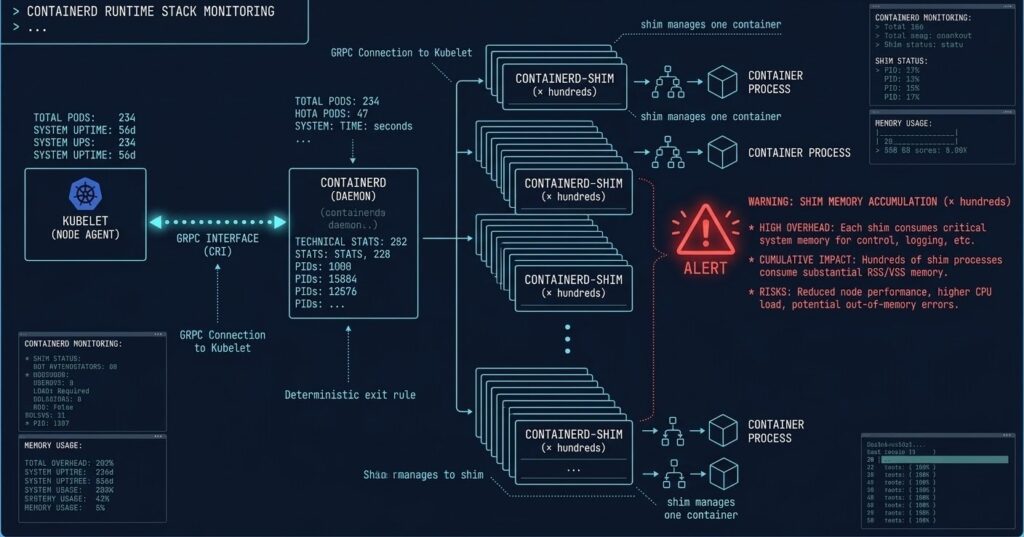
Before diagnosing failures, the execution chain needs to be precise. When Kubernetes schedules a pod, the sequence is:
Kubelet → gRPC → containerd → spawns → containerd-shim (per container) → runc → container process
The shim is the architectural detail most Day-2 problems trace back to. Unlike containerd itself, which is a single long-running daemon, the shim is a per-container process that stays alive for the entire container lifecycle. It handles:
- PID tracking for the container process
- stdout/stderr relay
- Exit code capture
- Signal forwarding
At 10 containers, this is invisible. At 800 containers, you are running 800 shim processes. That changes the failure math entirely.
The 5 Failure Patterns
The following patterns follow a consistent structure: the trigger condition, the failure signature as it appears in production, and the diagnostic path. Each pattern has a known threshold — the point at which it reliably manifests.
Failure Pattern #1: The containerd Shim Tax at High Pod Density
Trigger: Node density exceeds ~500 containers per node Failure signature: OOM kills on containers that appear resource-compliant
The Shim Tax is the most common Day-2 containerd failure in high-density environments, and the least visible until it kills something.
Each containerd-shim process consumes approximately 10–15 MB of resident memory. That number is static regardless of what the container itself is doing. The math becomes dangerous quickly:
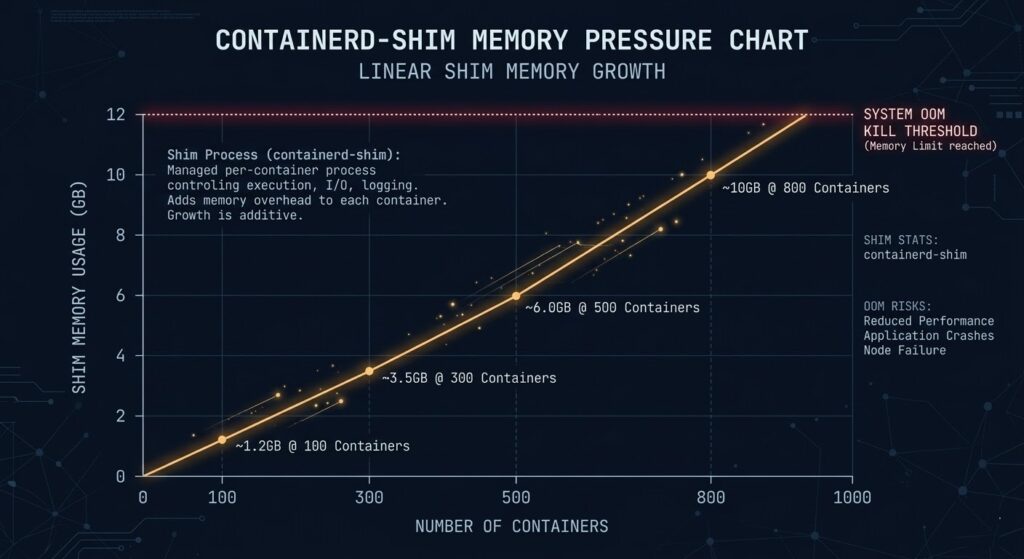
| Container Count | Shim Overhead (est.) | Available Node Headroom Lost |
|---|---|---|
| 100 containers | ~1.2 GB | Minor |
| 300 containers | ~3.5 GB | Moderate |
| 500 containers | ~6.0 GB | Significant |
| 800 containers | ~10.0 GB | Critical |
The OOM killer doesn’t distinguish between shim memory and container memory. When the node approaches its memory ceiling, it terminates processes — and shims and containers are equally valid targets.
Why dashboards miss it: Kubernetes resource accounting tracks container cgroup limits, not shim process overhead. A node can be technically under its container memory budget while the shim layer consumes enough unreserved memory to trigger OOM events.
Diagnostic path:
bash
# Count shim processes and total memory consumption
ps aux | grep containerd-shim | awk '{sum += $6} END {print "Total shim RSS: " sum/1024 " MB, Count: " NR}'

# Check OOM kill history
dmesg | grep -i "oom\|killed process" | tail -20
Mitigation: Reserve explicit non-container memory headroom at the kubelet level using --system-reserved and --kube-reserved flags. A practical floor for high-density nodes is 2–4 GB reserved above documented container limits. Additionally, evaluate crun as a replacement for runc — written in C rather than Go, it reduces per-shim overhead by approximately 30–40% in high-density configurations. For a full comparison of runtime selection decisions at the architecture level, see Architecting for Density: Docker vs Podman vs containerd.
Failure Pattern #2: Mixed cgroup v1/v2 Nodes Corrupt Resource Accounting
Trigger: Kubernetes cluster nodes running mixed cgroup versions during OS or kernel upgrades Failure signature: Pods report under CPU limits but exhibit throttling behavior; memory limits appear enforced but containers OOM unexpectedly
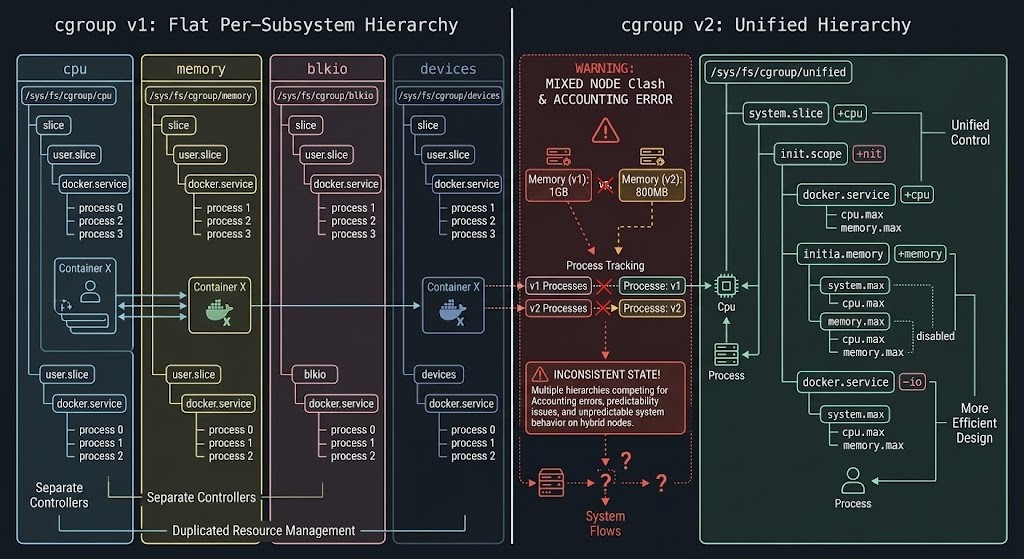
The Linux kernel shipped cgroup v2 as the unified hierarchy model, replacing the per-subsystem flat hierarchy of v1. containerd supports both. The failure emerges when a Kubernetes cluster contains nodes running different cgroup versions — which happens routinely during rolling OS upgrades, node pool migrations, or when new node images are deployed without explicit cgroup version pinning.
The resource accounting models are structurally incompatible:
| Dimension | cgroup v1 | cgroup v2 |
|---|---|---|
| Hierarchy | Per-subsystem flat | Unified single hierarchy |
| CPU accounting | cpu and cpuacct subsystems separate | Combined in unified tree |
| Memory accounting | memory subsystem | memory subsystem (different semantics) |
| I/O accounting | blkio subsystem | io subsystem (extended model) |
| Kubernetes support | Full | Requires kernel ≥ 5.8, containerd ≥ 1.4 |
In a mixed cluster, the Kubernetes scheduler has no visibility into cgroup version per node. Pods scheduled to cgroup v2 nodes running containerd configured for v1 semantics will have their resource limits enforced through the wrong accounting model. CPU throttling appears in container_cpu_cfs_throttled_seconds_total metrics without a corresponding limit violation in Kubernetes resource objects.
Diagnostic path:
bash
# Check cgroup version on a node
stat -fc %T /sys/fs/cgroup/

# Check containerd's cgroup driver configuration
containerd config dump | grep cgroup

# Verify kubelet cgroup driver matches
systemctl show kubelet | grep cgroup
What to look for: If stat returns cgroup2fs, the node is running v2. If containerd is configured with SystemdCgroup = false on a v2 node, resource accounting is broken. The kubelet’s --cgroup-driver flag must match containerd’s SystemdCgroup setting.
Mitigation: Enforce explicit cgroup version consistency across all node pools. During node pool migrations, use node taints to prevent mixed-version scheduling until the full pool is uniform. Add cgroup version verification to your node provisioning pipeline as a gate — not a check.
Failure Pattern #3: OverlayFS Layer Debt in Long-Running Nodes
Trigger: Node uptime exceeding 60–90 days without image cleanup Failure signature: Image pull times degrade from seconds to minutes; df -i shows inode exhaustion
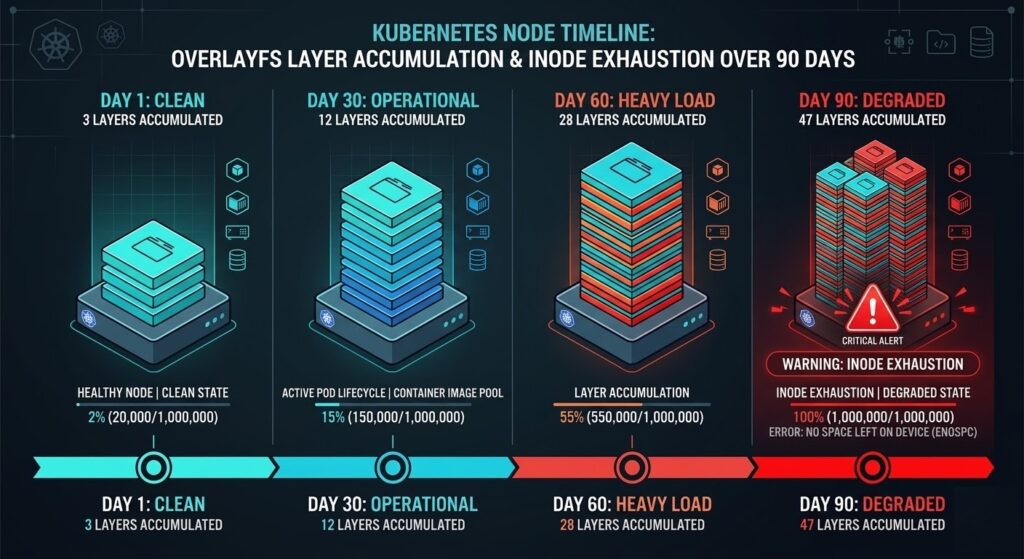
OverlayFS is containerd’s default storage driver. It uses a copy-on-write layered filesystem where each image consists of stacked read-only layers, with a writable layer per running container. This model is efficient at Day 1. Over time, it becomes a maintenance liability.
The failure accumulates through a predictable sequence on long-running nodes:
- Image pulls create new layer directories under
/var/lib/containerd/io.containerd.snapshotter.v1.overlayfs/ - Image updates add new layers without immediately removing old ones
- Deleted containers leave dangling snapshot references that GC does not always catch
- Node uptime compounds all of the above
The practical consequence is twofold. First, image pull performance degrades as the overlay filesystem walks an increasingly deep layer stack during mount operations. Second, on nodes with high container churn running many distinct images, inode exhaustion occurs before disk capacity exhaustion — a failure mode that appears as “No space left on device” errors even with gigabytes of available disk space.
Diagnostic path:
bash
# Check snapshot count and disk usage
du -sh /var/lib/containerd/
find /var/lib/containerd/io.containerd.snapshotter.v1.overlayfs/snapshots/ -maxdepth 1 -type d | wc -l

# Check inode utilization
df -i /var/lib/containerd/

# List images and their layer counts
ctr images ls
ctr snapshots ls | wc -l
Trigger threshold: When snapshot count exceeds approximately 2,000–3,000 on a standard node configuration, pull performance begins degrading measurably. When inode utilization exceeds 85%, image pulls start failing intermittently.
Mitigation: Implement node-level image cleanup as a DaemonSet running crictl rmi --prune on a scheduled interval. Consider node rotation policies that rebuild nodes every 60–90 days rather than relying on in-place cleanup. For clusters with high image churn, explicitly configure containerd’s GC parameters in /etc/containerd/config.toml:
toml
[plugins."io.containerd.grpc.v1.cri".containerd]
  snapshotter = "overlayfs"

[plugins."io.containerd.grpc.v1.cri".containerd.default_runtime]
  [plugins."io.containerd.grpc.v1.cri".containerd.default_runtime.options]
    # Increase GC aggressiveness
    GCPercent = 50
Failure Pattern #4: containerd Snapshot Garbage Collection Drift
Trigger: Long-running clusters with high container churn and no explicit GC tuning Failure signature: Gradual degradation in image pull latency; storage consumption growing despite containers being deleted
Snapshot GC Drift is the slower cousin of OverlayFS Layer Debt. Where Pattern #3 manifests through inode exhaustion and layer stack depth, Pattern #4 is specifically about orphaned snapshot entries — snapshots that containerd’s internal GC fails to collect because the reference graph becomes inconsistent.
This happens through three primary mechanisms:
| Mechanism | Description | Detection |
|---|---|---|
| Dangling snapshots | Snapshots with no active container reference that GC skips due to reference counting errors | ctr snapshots ls vs ctr containers ls delta |
| Lease accumulation | containerd leases that were never explicitly released by clients | ctr leases ls count growing unbounded |
| Content store orphans | Image content (layers) referenced by snapshots but not by any active image manifest | ctr content ls size vs ctr images ls expected size |
The GC runs on a default interval that is conservative by design — containerd’s GC is tuned to avoid false deletions at the cost of allowing orphan accumulation. In clusters processing hundreds of pod create/delete cycles per hour, the accumulation rate exceeds the default GC rate.
Diagnostic path:
bash
# Force a GC run and observe what gets collected
ctr content gc --verbose 2>&1 | tail -30

# Check lease accumulation
ctr leases ls | wc -l

# Compare snapshot count to running container count
echo "Snapshots: $(ctr snapshots ls | wc -l)"
echo "Containers: $(ctr containers ls | wc -l)"
A healthy ratio between snapshots and containers varies by workload, but a snapshot count that is more than 3–5× the container count warrants investigation.
Mitigation: Configure explicit GC thresholds in containerd configuration and implement a periodic forced GC via a privileged DaemonSet. For clusters with persistent drift issues, evaluate moving to a separate containerd data root on a dedicated volume to isolate storage growth from node OS space.
Failure Pattern #5: containerd gRPC Socket Saturation Under Rapid Pod Cycling
Trigger: High pod churn environments — CI/CD clusters, ephemeral job runners, GitHub Actions nodes Failure signature: Pod scheduling delays that appear as node pressure but show no CPU or memory constraint; kubectl describe node shows KubeletHasTooManyPods without approaching the pod limit
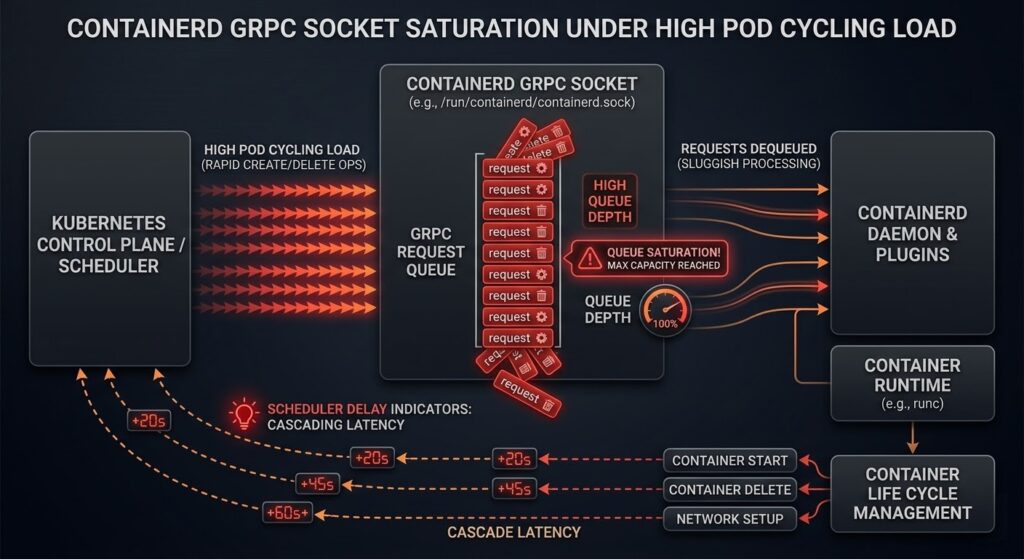
This is the most architecturally interesting failure pattern because it is entirely invisible to standard Kubernetes observability tooling. The containerd gRPC socket (/run/containerd/containerd.sock) processes requests serially per operation type. In normal production workloads, this is not a constraint. In environments with rapid pod cycling — where hundreds of pods are created and deleted per hour — the socket becomes a serialization bottleneck.
The failure sequence:
- CI/CD pipeline triggers 50+ pod creates in rapid succession
- Each create requires:
PullImage→CreateContainer→StartContainergRPC calls - containerd processes these serially on the socket
- Kubelet’s CRI client begins queuing requests
- Pod startup latency increases from seconds to minutes
- Kubelet reports node pressure to the scheduler before any actual resource constraint exists
The deceptive element is that kubectl top nodes shows the node as underutilized. CPU and memory are available. The scheduler sees pressure that doesn’t match resource metrics — which leads most operators to investigate node resources rather than the socket layer.
Diagnostic path:
bash
# Check containerd socket queue depth (requires strace or custom tooling)
# Simpler: measure pod startup latency directly
kubectl get events --field-selector reason=Started --sort-by='.lastTimestamp' | tail -20

# Check containerd task service metrics if metrics endpoint is enabled
curl -s http://localhost:1338/v1/metrics | grep containerd_task

# Monitor socket utilization
ss -x | grep containerd
Mitigation: For high-churn environments, evaluate splitting workloads across node pools where batch/CI workloads run on dedicated nodes, preventing socket saturation from affecting production pod scheduling. Additionally, tune the kubelet’s --max-pods setting conservatively for high-churn nodes — the default of 110 pods assumes steady-state workloads, not rapid cycling patterns.
For GitHub Actions runners specifically, the actions-runner-controller project includes node pool isolation patterns that address this failure mode directly.
Diagnostic Summary: When to Expect These Failures
These patterns do not appear randomly. They emerge at predictable operational thresholds:
| Failure Pattern | Primary Trigger | Secondary Signal |
|---|---|---|
| Shim Tax | >500 containers per node | OOM kills on compliant containers |
| cgroup v1/v2 Drift | Mixed-version node pool | CPU throttling without limit violation |
| OverlayFS Layer Debt | Node uptime >60–90 days | Image pull time degradation |
| Snapshot GC Drift | High churn + no GC tuning | Storage growth despite container deletion |
| Socket Saturation | >100 pod creates/hour | Scheduling delays without resource pressure |
If your Kubernetes cluster is approaching any of these thresholds, these failure modes will eventually appear. The only variable is timing.
These patterns are predictable. The diagnostics are repeatable. The mitigations are operational decisions — not emergency responses. Each failure signature maps directly to the diagnostic loops in the Rack2Cloud Kubernetes Day-2 Method.
The failure patterns in this post map directly to the Storage and Compute diagnostic loops in the Rack2Cloud K8s Day-2 Method. The full failure signature library — including containerd-specific indicators — is in the playbook.
→ Download the K8s Day-2 PlaybookFrequently Asked Questions
Q: Does switching from runc to crun solve the Shim Tax problem?
A: Partially. crun reduces per-shim memory overhead by approximately 30–40% compared to runc due to its C implementation versus Go’s runtime overhead. At 800 containers, that difference represents several gigabytes of recovered headroom. However, crun does not eliminate the shim architecture — each container still gets a shim process. For extreme density requirements (>1,000 containers per node), evaluate Kata Containers with shared kernel mode, which uses a different execution model.
Q: How do I verify containerd’s cgroup driver without taking a node offline?
A: Run containerd config dump | grep -A5 cgroup on the node. The SystemdCgroup field in the CRI plugin configuration determines the driver. Cross-reference with cat /proc/1/cgroup to confirm the node’s actual cgroup version.
Q: Is snapshot GC drift a containerd bug or a configuration problem?
A: Configuration and operational practice. containerd’s conservative GC defaults are intentional — aggressive GC in a distributed system risks deleting content that is in use. The drift becomes a problem when cluster operational patterns (high churn, infrequent node rotation) create accumulation rates that exceed the default GC cadence. Explicit GC configuration and forced GC runs are the correct response.
Q: Does this apply to CRI-O clusters?
A: The cgroup v1/v2 drift pattern and OverlayFS layer debt apply equally to CRI-O. The Shim Tax and socket saturation patterns are containerd-specific — CRI-O uses a different shim architecture (conmon) with different memory characteristics.
Additional Resources
Editorial Integrity & Security Protocol
This technical deep-dive adheres to the Rack2Cloud Deterministic Integrity Standard. All benchmarks and security audits are derived from zero-trust validation protocols within our isolated lab environments. No vendor influence.
R.M.
Senior Solutions Architect with 25+ years of experience in HCI, cloud strategy, and data resilience. As the lead behind Rack2Cloud, I focus on lab-verified guidance for complex enterprise transitions. View Credentials →
Get the Playbooks Vendors Won’t Publish
Field-tested blueprints for migration, HCI, sovereign infrastructure, and AI architecture. Real failure-mode analysis. No marketing filler. Delivered weekly.
Select your infrastructure paths. Receive field-tested blueprints direct to your inbox.
- > Virtualization & Migration Physics
- > Cloud Strategy & Egress Math
- > Data Protection & RTO Reality
- > AI Infrastructure & GPU Fabric
Zero spam. Includes The Dispatch weekly drop.
Need Architectural Guidance?
Unbiased infrastructure audit for your migration, cloud strategy, or HCI transition.
>_ Request Triage Session