AI Inference Saturation Analyzer
Surface the Interaction Collapse Point, Token Queue Amplification, and the Throughput Illusion — the runtime signals your GPU utilization dashboard does not show.
Your GPU utilization dashboard says the cluster is busy. Your throughput dashboard says tokens-per-second are healthy. Both can be true while the service is unusable. GPU utilization is not interactive capacity, and aggregate throughput is not responsiveness.
Inference saturation is nonlinear. As concurrency rises, latency does not degrade gracefully along a straight line — it holds, then bends, then amplifies. A serving deployment that comfortably handles 60 concurrent sessions does not handle 120 twice as slowly; past a specific concurrency knee, queue amplification overtakes batching efficiency and tail latency multiplies. Most teams discover that knee in production, during a launch, when the dashboards still look green. The number that matters is not tokens-per-second. It is the concurrency beyond which interactive quality collapses — and almost nobody has operational intuition for where it sits.
The AI Inference Saturation Analyzer is built on that distinction. It does not benchmark your cluster or read telemetry. It composes a transparent parametric model of four interacting subsystems — prefill, decode, queue amplification, and the KV-cache concurrency ceiling — and surfaces the degradation behaviour under your explicitly stated serving assumptions. The point is not to predict a precise collapse number. It is to show the shape of the curve, name the first subsystem that binds, and expose every assumption underneath.
What the Inference Saturation Analyzer Surfaces
Layer 01 — Prefill Saturation (TTFT)
Time-to-first-token degradation as concurrent prompts contend for forward-pass capacity. Long average input length amplifies this — the queue to begin generation can grow faster than generation itself slows.
Layer 02 — Decode Saturation (TPOT)
Inter-token latency degradation as the decode batch fills. Past the decode-saturation batch, continuous batching stops amortizing weight loads and per-token generation slows for every concurrent stream at once. Static batching saturates far earlier.
Layer 03 — Queue Amplification
The nonlinear latency escalation that begins once offered load approaches served capacity. This is where tail latency is manufactured by the waiting line rather than the work — the dominant mechanism behind the Interaction Collapse Point.
Layer 04 — KV-Cache Concurrency Ceiling
The admission limit set by KV-cache residency. Context window and per-sequence KV footprint — not raw FLOPs — cap how many concurrent sequences the deployment can hold. Beyond it, sessions queue at admission regardless of available compute. The economics of persistent inference begin here.
The Interaction Collapse Point
The analyzer’s primary output is the Interaction Collapse Point — the approximate concurrency beyond which serving latency stops scaling linearly and begins amplifying. It is rendered as a hero figure against the advertised peak target you configured, alongside the Effective Interactive Capacity: the sessions actually served within your latency SLO. The gap between advertised and effective is where the throughput illusion lives.
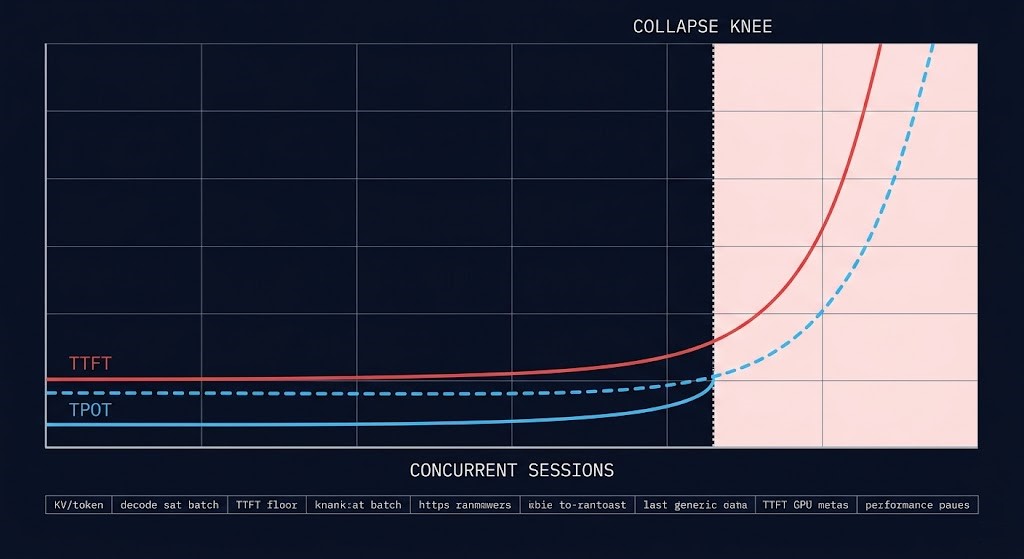
Crucially, the collapse point is never presented as a precise oracle. It sits beneath separate TTFT and TPOT degradation curves with the collapse region shaded and every model constant — and the KV-cache concurrency ceiling — constraints that originate at the accelerator compute layer, before any serving framework is involved — listed in an assumptions panel. Change an input and watch the knee move. The credibility of the tool is in the transparency of the model, not the confidence of a single figure.
Concurrency Elasticity Signal
Where your configured peak target sits relative to effective capacity produces a named elasticity classification — not a score. Four tiers:
Peak target sits comfortably below effective capacity. Concurrency scales near-linearly and latency holds within SLO across the operating range. Headroom absorbs variance and burst without amplification.
Peak target approaches effective capacity. Degradation is emerging at the top of the range and headroom for variance is thinning. The band to watch, not yet the band to fear.
Peak target exceeds effective capacity. Queue amplification is active at peak — tail latency multiplies and interactive quality degrades for a growing fraction of sessions during peak windows.
Peak target is well beyond effective capacity. The deployment cannot serve the intended concurrency interactively under these assumptions — it is in the steep region where small load increases produce large latency increases.
The Stable tier carries equal weight to the Collapse Regime. When a deployment genuinely has the headroom to serve its target concurrency, the analyzer says so. That neutrality is what makes the collapse signal land when it fires — a tool that always reports saturation is advocacy, not analysis.
Output Architecture
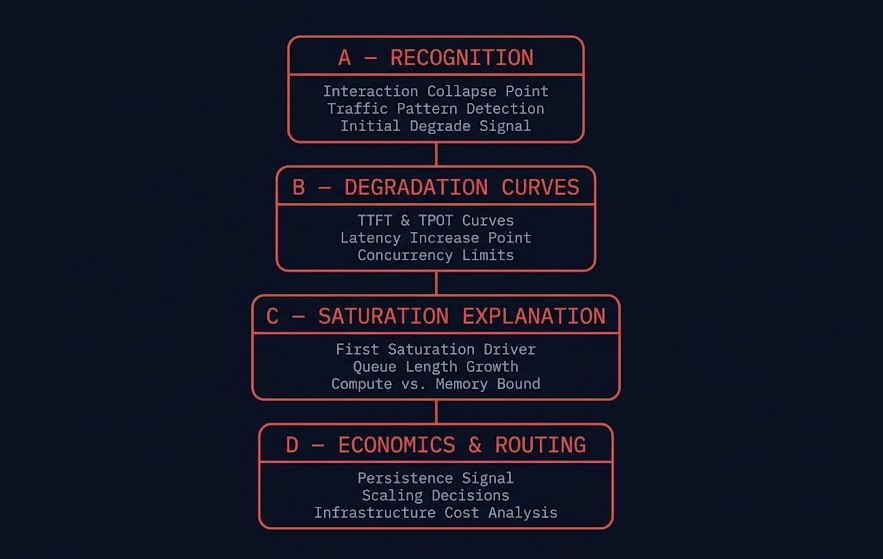
Outputs are delivered in four blocks — recognition first, degradation curves second, saturation explanation third, economics and routing fourth.
| Output | What It Surfaces |
|---|---|
| Interaction Collapse Point | Hero output: the concurrency knee where latency amplification overtakes batching efficiency, against the advertised peak target |
| Effective Interactive Capacity | Advertised peak vs sessions actually served within SLO — the screenshot that starts the conversation, with the queue amplification multiplier |
| Phantom Throughput Detection | Whether aggregate tokens/sec stays high while interactive latency collapses — the dashboard-is-lying-to-you signal |
| Throughput Illusion Index | % delta between advertised aggregate throughput and throughput delivered within the latency SLO — the runtime sibling of Effective GPU Yield |
| TTFT & TPOT Curves | Separate time-to-first-token and inter-token latency degradation curves vs concurrency, with the collapse knee marked and assumptions exposed |
| First Saturation Driver | The single architectural sentence identifying which subsystem binds first — KV ceiling, decode saturation, prefill amplification, or queue amplification |
| Queue Amplification Signal | Quantified latency multiplier at the offered peak, with utilization ρ and the variance/burst-adjusted offered load |
| Concurrency Elasticity Signal | Stable / Soft Saturation / Amplified Saturation / Collapse Regime — where the target sits on the saturation curve |
| Persistent Inference Density Signal | Persistent / Mixed / Elastic — routes to the Cloud Repatriation Economics Engine when steady serving may amortize on dedicated infrastructure |
| Placement Pressure Signal | Cloud / Sovereign / Hybrid-serving favourable — routes to the AI Gravity & Placement Engine |
| GPU Yield Dependency | Effective interactive capacity is bounded above by effective GPU yield — routes to the GPU Utilization & AI Capacity Analyzer to validate the denominator |
Named Frameworks
Four architectural frameworks underpin the analyzer’s output logic. KV-cache pressure is referenced throughout as established industry terminology — it is not claimed as a coined framework.
| Framework | Definition |
|---|---|
| Interaction Collapse Point | The concurrency threshold beyond which serving latency stops scaling linearly and begins amplifying nonlinearly — where queue amplification overtakes batching efficiency |
| Inference Saturation Curve | The nonlinear latency response of an inference deployment as concurrency rises — distinct TTFT and TPOT degradation profiles meeting at a collapse knee |
| Token Queue Amplification | Latency multiplication produced by request queueing once offered load approaches served capacity — tail latency manufactured by the waiting line, not the work |
| Throughput Illusion | High aggregate tokens/sec masking unusable interactive latency — the gap between a cluster that is busy and a cluster that is responsive |
The Runtime Layer of the AI Infrastructure Toolkit
The AI Inference Saturation Analyzer is the runtime layer of the AI Infrastructure Toolkit. Each tool surfaces a distinct plane of AI infrastructure behaviour; this one surfaces the plane that production teams hit first and understand least — runtime concurrency collapse:
AI Infrastructure Operational Stack
The planes interlock. Effective interactive capacity is bounded above by effective GPU yield — the saturation curve assumes the fleet actually delivers its provisioned accelerator capacity, which the GPU Utilization & AI Capacity Analyzer validates. When the analyzer surfaces a persistent inference density signal, the Cloud Repatriation Economics Engine models whether that steady serving load amortizes better on dedicated infrastructure. The collapse point is not only a hardware signal — it is a placement signal. When the analyzer surfaces an unexplained saturation signal with healthy GPU yield and placement economics, fabric pressure is the next diagnostic layer — the AI Fabric Pressure Analyzer models whether east-west congestion or or oversubscription is constraining effective throughput upstream of the serving layer.
AI Inference Saturation Analyzer: Key Features
- Interaction Collapse Point Detection: The primary output is a named architectural threshold, not a benchmark figure — the approximate concurrency beyond which latency amplification overtakes batching efficiency, presented against your advertised peak target and beneath the degradation curves that produce it.
- Separate TTFT and TPOT Curves: Prefill and decode saturate differently — KV-cache pressure caps concurrent sequences while batching saturates decode throughput. The analyzer models them as two distinct curves rather than collapsing them into one misleading latency number.
- Throughput Illusion Index: The percentage delta between advertised aggregate tokens/sec and throughput actually delivered within your latency SLO. This is the runtime sibling of Effective GPU Yield — high utilization of a metric that does not correspond to usable interactive service.
- Exposed Assumptions Panel: Every model constant used for a given run — KV bytes per token, memory bandwidth, decode saturation batch, usable VRAM fraction, replica and tensor-parallel topology — is listed on the page. The collapse point is a directional signal under stated assumptions, and the assumptions are never hidden.
- Client-Side Only: No data leaves the browser. No telemetry, no server-side logging, no account required. The analyzer runs entirely in the local browser session against your inputs.
THE ANALYZER SURFACES THE COLLAPSE POINT.
A REVIEW MOVES THE KNEE.
The collapse point names where interactive quality degrades under stated assumptions. A cost architecture review maps it to your real traffic distribution, replica topology, and SLO commitments — and identifies the serving-architecture changes that move the knee without adding GPUs.
|
>_ Architectural Guidance
Cost Architecture ReviewStructured review of your inference serving architecture and saturation profile against your real traffic shape, SLO targets, and replica topology.
|
>_ The Dispatch
Architecture Playbooks. Field-Tested Blueprints.Inference serving architecture, AI infrastructure cost patterns, and runtime capacity planning — delivered as field-tested operational blueprints.
Zero spam. Unsubscribe anytime. |
Frequently Asked Questions
What does the AI Inference Saturation Analyzer actually measure?
The analyzer takes your model and hardware profile, serving architecture, traffic shape, and SLO targets — and returns an architectural saturation assessment built on a transparent parametric model of four interacting subsystems: prefill (TTFT), decode (TPOT), queue amplification, and the KV-cache concurrency ceiling. It does not connect to your serving stack, run a benchmark, or read telemetry. The output is deterministic — the same inputs produce the same analysis every run, with every model constant exposed on the page.
Is this a benchmark or a precise production forecaster?
No. It is an architectural saturation analyzer, not a benchmark suite, synthetic performance lab, or precise production forecaster. The KV-per-token and bandwidth figures are first-order approximations, and real numbers vary with sequence-length distribution, model architecture specifics, and scheduler behaviour. The Interaction Collapse Point is a directional architecture signal under explicitly stated assumptions — the value is in the shape of the curve and the named first saturation driver, not in a precise concurrency number.
Why model TTFT and TPOT as separate curves?
Because concurrency affects them through different mechanisms. Time-to-first-token degrades through prefill compute contention and admission queueing; inter-token latency degrades through decode-batch saturation and KV-cache pressure. A single blended latency number hides which subsystem is actually binding first. Separating the curves is what lets the analyzer name the First Saturation Driver — the specific architectural reason the deployment collapses where it does.
What is the Throughput Illusion?
The Throughput Illusion is high aggregate tokens-per-second masking unusable interactive latency. A serving deployment can report a large aggregate token rate at peak concurrency while individual sessions experience latency that makes the service unusable — the dashboard looks healthy while users wait. The Throughput Illusion Index quantifies the gap between advertised aggregate throughput and throughput actually delivered within your latency SLO. It is the inference-runtime sibling of Effective GPU Yield.
How does this connect to the other AI infrastructure tools?
Effective interactive capacity is bounded above by effective GPU yield, so the analyzer routes to the GPU Utilization & AI Capacity Analyzer to validate the underlying fleet. When it detects a persistent inference density signal, it routes to the Cloud Repatriation Economics Engine to model dedicated-infrastructure economics. When the collapse point is really a placement problem, it routes to the AI Gravity & Placement Engine. The analyzer is the runtime layer of the AI Infrastructure Toolkit — the other planes are compute, storage, and placement.
🔒 Privacy Architecture: No cookies. No tracking pixels. No server-side database.
This logic runs entirely in your local browser session.