Nutanix Metro Availability: Monitoring Latency in the Millisecond Era
Nutanix Metro latency failures don’t announce themselves — they hide inside 60-second polling windows until synchronous replication degrades and the protection domain makes the split-second decision to break the mirror.
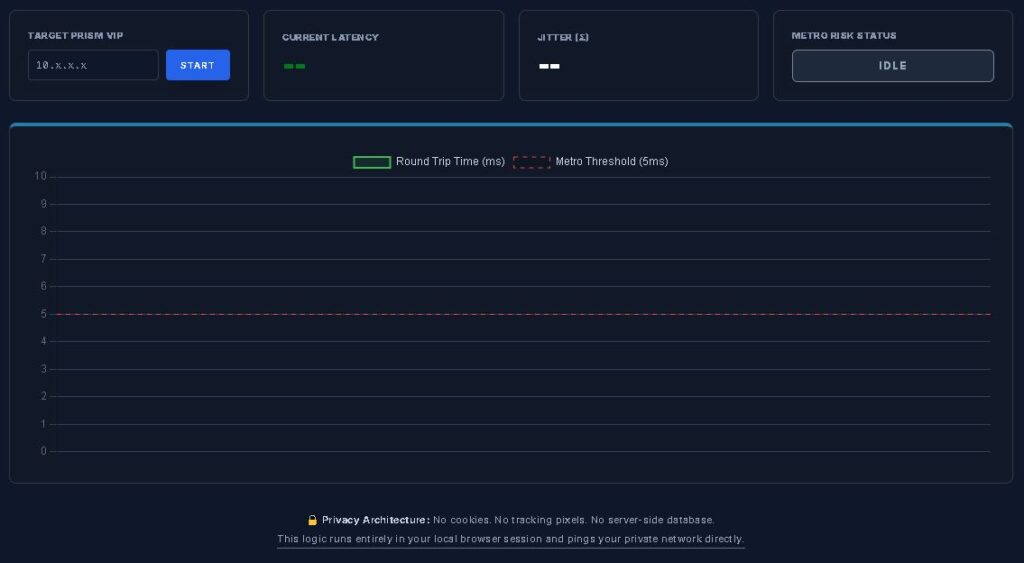
Browser-Based RTT & Jitter Detection at 250ms Resolution
Standard dashboards poll every 60 seconds. Metro failures happen in milliseconds. The Scout runs directly in your browser — no agents, no installs, no data leaving your network — and maps the micro-bursts that trigger synchronous replication degradation before they appear in Prism.
The 5ms Problem: Why Standard Monitoring Fails Metro
Nutanix Metro Availability relies on synchronous replication. For every write operation on the primary cluster, data must be successfully written to the remote cluster before the acknowledgement returns to the virtual machine.
If the Round Trip Time between sites exceeds 5ms, the Nutanix storage fabric must make a split-second decision:
- Wait for acknowledgement: Increases I/O Wait time for the application — database timeouts, application lag, VDI session freezes
- Break the mirror: If latency remains elevated, the protection domain automatically disables synchronous replication to prevent a site-wide performance collapse
The problem with traditional SNMP or cloud-based monitoring is polling resolution. Most tools poll every 60 seconds. A 200ms latency spike lasting only 2 seconds gets averaged into the 60-second window — appearing as a harmless 2.1ms blip. Your dashboard looks fine. Your Metro cluster does not.
The physics behind why this happens — microburst behavior, TCP retransmit amplification, and jitter variance under concurrent I/O load — is covered in full in The Physics of Disconnected Cloud: Modeling Microbursts & Metro Risk.
Understanding Jitter (σ): The Metric Your Dashboard Ignores
Latency is only half the story. To truly understand the health of your dark fiber or SD-WAN link, you must measure Jitter — the standard deviation of your latency samples.
In a healthy Metro configuration, latency should be consistent. If your RTT fluctuates between 2ms and 15ms, that jitter is the actual failure signal — not the average. High jitter is typically caused by:
- Buffer Bloat: Network switches on the replication path are over-subscribed during concurrent traffic events
- Path Re-routing: ISP flapping between primary and backup circuits introduces non-deterministic packet delivery
- Encapsulation Overhead: Metro over VPN or VXLAN adds variable overhead that disrupts consistent packet timing
- Microburst Events: VM live migration waves, storage rebuild events, and backup job initiation all create sudden traffic spikes that overwhelm switch buffers
The Metro Latency Scout calculates the standard deviation of your last 50 probes in real-time — providing a live risk score that a standard ping command cannot produce. The jitter threshold that governs Metro stability is <1ms under concurrent load. The Scout tells you exactly where you stand.
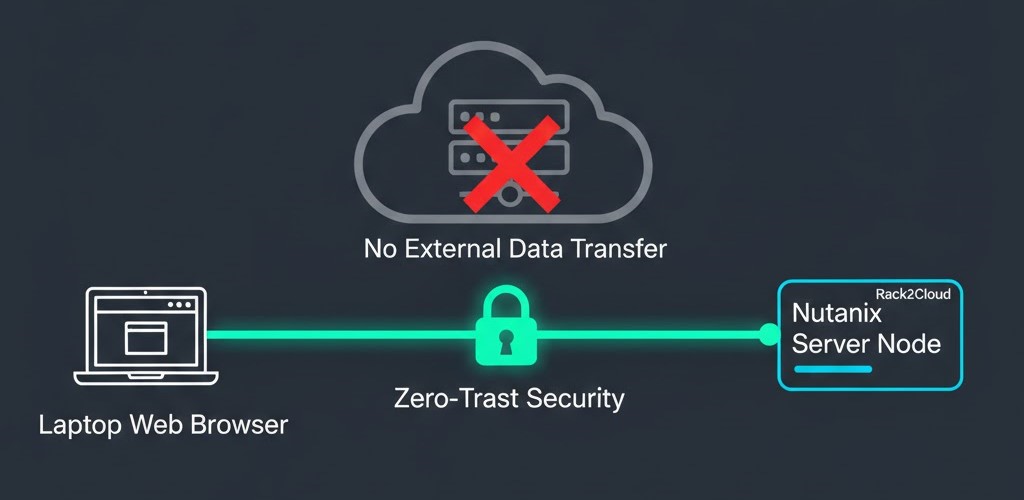
How the Scout Works: Browser-Based Sovereign Probing
The Scout uses a zero-trust architecture. No agents on your CVMs. No software installation. No data leaving your network.
The Favicon Head Request Method
The tool performs high-frequency HTTPS HEAD requests to the Nutanix Prism favicon at 250ms intervals. Because the favicon is a lightweight asset served by the Prism web server, it provides an accurate measure of the full application round-trip time — including the time for the Prism service to respond across the storage fabric.
Security & Sovereignty
All logic executes entirely in your local browser session. Your Prism VIPs, latency data, and cluster IPs never leave your local network. No data is sent to Rack2Cloud or any third-party analytics provider. The Scout stays within your secure perimeter by design.
Troubleshooting High Metro Latency
If the Scout reveals a DEGRADED risk score or consistent spikes above 5ms, follow this diagnostic sequence:
- Verify MTU Consistency: Ensure MTU is consistent — typically 1500 or 9000 for Jumbo Frames — across the entire replication path. A single mismatch causes packet fragmentation and immediate latency spikes
- Check for Micro-Flaps: Use the Scout’s real-time graph to correlate spikes with scheduled tasks — backups, large VM migrations, storage rebuild events
- Validate SSL/TLS Handshake: If current latency is high but standard ICMP ping is low, the issue may be Prism web server resource allocation or heavy CVM load rather than the network path
- Run Under Concurrent Load: Idle measurements are meaningless for Metro qualification. The Scout should be running while simultaneously generating synthetic replication-pattern traffic to surface the real worst-case envelope
For the complete 6-point Go/No-Go pre-flight framework — including baseline RTT under load, packet loss floor validation, and burst event simulation — see The Physics of Disconnected Cloud. For the full Metro cluster implementation sequence including hardware requirements, network topology, and Nutanix AOS configuration steps, see the Metro Cluster Implementation Checklist.
FAQ for Nutanix Administrators
Q: Why does the tool require me to open Prism in a new tab first?
A: Modern browsers block communication with self-signed certificates until you manually acknowledge them. Open the Prism VIP in a separate tab, accept the certificate warning, close that tab, then click Start Monitor. The Scout can then probe freely within that browser session.
Q: Can I run this continuously?
A: Yes — the tool is lightweight by design. We recommend running it during change windows, pre-migration validation, or when actively troubleshooting replication issues. For ongoing production monitoring, combine the Scout with your standard Prism alerting for layered visibility.
Q: What is an “Optimal” Jitter score?
A: For Nutanix Metro, target a jitter standard deviation below 1.0ms. Anything higher indicates network path inconsistency that could trigger unexpected protection domain flapping or Automatic Image Service (AIS) events.
Q: Does this support both AHV and ESXi?
A: Yes. The Scout pings the Prism VIP directly, making it hypervisor-agnostic. It measures storage fabric round-trip time regardless of the underlying compute platform.
Q: What is the variance modeling formula for Metro margin?
A: Worst-Case Latency Envelope = Baseline RTT + (Jitter Standard Deviation × Burst Coefficient). Your worst-case envelope should clear the 5ms Metro threshold with at least 30% headroom under simulated stress. A 0.6ms margin is not headroom — it’s a single rebuild event away from failure. The full formula with worked examples is in Part 2 of the Migration Series.
Who Should Use the Metro Latency Scout
The Scout is built for infrastructure architects and senior engineers who need sub-second visibility into Metro replication stability — specifically:
- Engineers validating inter-site links before enabling Metro Availability for the first time
- Architects troubleshooting unexplained protection domain flapping or degraded replication states
- Teams running pre-migration validation as part of a structured migration path from VMware to Nutanix AHV
- Operations teams building a pre-change-window checklist for environments with active Metro replication
For a complete understanding of the physics that govern Metro cluster stability — RTT vs jitter vs packet loss, microburst detection, and variance modeling — the HCI Architecture Learning Path covers Metro deployment as a structured progression from single-site HCI through active-active Metro configurations. For the full breakdown of why standard monitoring tools miss Metro micro-bursts — including the polling gap physics and cost analysis — see The 5ms Problem.
Privacy Architecture
The Metro Latency Scout operates on a zero-backend principle. No cookies. No tracking pixels. No server-side database. The probing logic runs entirely within your local browser session and communicates directly with your private network. No IP addresses, latency readings, or cluster identifiers are transmitted to Rack2Cloud or any third-party service.
Additional Resources
For deeper technical context on Metro cluster architecture and latency physics:
Editorial Integrity & Security Protocol
This technical deep-dive adheres to the Rack2Cloud Deterministic Integrity Standard. All benchmarks and security audits are derived from zero-trust validation protocols within our isolated lab environments. No vendor influence.
R.M.
Senior Solutions Architect with 25+ years of experience in HCI, cloud strategy, and data resilience. As the lead behind Rack2Cloud, I focus on lab-verified guidance for complex enterprise transitions. View Credentials →
Get the Playbooks Vendors Won’t Publish
Field-tested blueprints for migration, HCI, sovereign infrastructure, and AI architecture. Real failure-mode analysis. No marketing filler. Delivered weekly.
Select your infrastructure paths. Receive field-tested blueprints direct to your inbox.
- > Virtualization & Migration Physics
- > Cloud Strategy & Egress Math
- > Data Protection & RTO Reality
- > AI Infrastructure & GPU Fabric
Zero spam. Includes The Dispatch weekly drop.
Need Architectural Guidance?
Unbiased infrastructure audit for your migration, cloud strategy, or HCI transition.
>_ Request Triage Session