Refactoring Cliff Calculator
Economic Cliff Score · Migration Complexity · Refactoring Cliff Index · 5-Year Avoidable Spend
Most LCNC cost analyses stop at a single comparison: what you pay per seat versus what Lambda would cost per million invocations. That framing misses the actual architecture question. The real comparison is between two complete application platforms — a managed LCNC environment with its licensing model, vendor controls, and data residency constraints, against a native serverless stack with its own operational overhead, engineering investment, and infrastructure ownership burden.
The Refactoring Cliff Calculator is built around that distinction. It models the full execution platform cost on the serverless side — invocations, compute duration, and platform overhead at three tiers — and measures it against your actual contract rate, not an industry average. More importantly, it measures when migration makes sense, not just whether it is cheaper on paper. An app with 40 users, low platform coupling, and a 30-month break-even should not receive the same recommendation as a revenue-critical workflow running on OutSystems SaaS with five years of accumulated custom logic.
The three-section structure mirrors how architects actually evaluate this decision. Section 1 answers the CFO question: is the licensing model becoming economically irrational? Section 2 answers the CTO question: how painful will migration actually be? Section 3 produces the Refactoring Cliff Index — a composite score that maps your position on the Refactoring Cliff Model framework and drives a verdict the entire leadership team can act on.
What the Refactoring Cliff Calculator Surfaces
01 — Economic Model
LCNC monthly cost against full execution platform cost — invocations, compute duration, and platform overhead modeled separately. Three-year projection table compounding both sides at your selected growth profile. Five-year avoidable spend in large typography — the number that belongs in a migration business case, not a monthly dashboard.
02 — Migration Signals
Lock-In Exposure derived from platform family and hosting model. Technical Debt Velocity scored from logic complexity, API integration count, and platform age. Architectural Pressure as a composite signal. Migration Complexity Score as a standalone output — readable by engineering leadership independently of cost.
03 — Refactoring Cliff Assessment
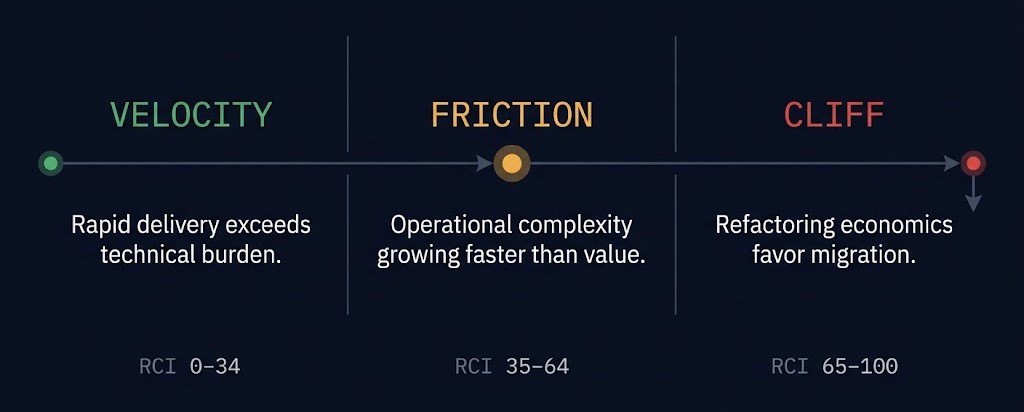
The Refactoring Cliff Index (RCI) as a 0–100 composite of economic and migration signals. Stage rail positioning on the Refactoring Cliff Model — Velocity, Friction, or Cliff. Two-by-two verdict matrix with the active cell lit. Primary recommendation with rationale for each of the five verdict paths.
The Refactoring Cliff Model — Framework #130
The three-stage framework that structures the calculator’s output reflects a pattern that appears consistently in enterprise LCNC adoption cycles. Stage 1 — Velocity — is where most teams begin. The platform delivers fast iteration and low operational overhead. Licensing is manageable. The trade-off is worth it. Stage 2 — Friction — is where the curve turns. User counts grow. Custom logic accumulates. API integrations multiply. The platform that enabled rapid delivery begins extracting a compounding tax on every evolution. Stage 3 — Cliff — is where the economic math inverts. The cost of staying exceeds the cost of migrating — but only when both sides of that comparison are modeled correctly.
The calculator operationalizes all three stages through two independent scores:
Economic Cliff Score (ECS)
Pure financial pressure. Weighted across monthly license spend, user growth trajectory, savings potential, and break-even period. Answers the CFO question: is the licensing model becoming economically irrational? Scores 0–100 across four tiers: Economically Stable, Watch, Approaching Cliff, Cliff Confirmed.
Migration Complexity Score (MCS)
Migration friction signal. Weighted across platform lock-in, workflow criticality, API integration count, custom logic complexity, and compliance requirements. Answers the CTO question: how painful will migration actually be? Scores 0–100 across four tiers: Low Complexity, Moderate, High, Critical.
Refactoring Cliff Index (RCI)
Composite strategic signal. ECS weighted at 55%, MCS at 45%. Drives the stage rail position and the 2×2 verdict matrix. Four verdict paths: Strong Migration Candidate, Strategic Modernization Program, Maintain LCNC, and Defer — Architectural Risk Not Cost. A fifth path — Refactoring Not Justified — fires when all low-pressure conditions are simultaneously true.
The 2×2 Verdict Matrix
The final verdict maps Economic Cliff Score against Migration Complexity Score. The combination determines not just whether to migrate, but what kind of program the migration actually requires.
| Verdict | ECS | MCS | Meaning |
|---|---|---|---|
| Strong Migration Candidate | High (60+) | Low (<40) | Economics justify migration and complexity is manageable. Begin refactoring sequencing. |
| Strategic Modernization Program | High (60+) | High (60+) | Both economic pressure and migration complexity are elevated. Phased program required — not a lift-and-shift. |
| Maintain LCNC | Low (<40) | Low (<40) | LCNC is delivering value at acceptable cost. Revisit at 20% user growth. |
| Defer — Architectural Risk, Not Cost | Low (<40) | High (60+) | Cost pressure is low but platform coupling is significant. Lock-in is accumulating — flag for next architecture review. |
| Monitor | Watch (40–59) | Any | Economic pressure is building but has not crossed the migration threshold. Remodel in 90 days. |
Key Features
- Three-Section Progressive Diagnostic: Economic Model surfaces cost pressure. Migration Signals surface platform coupling and technical debt velocity. Refactoring Cliff Assessment produces the composite RCI and verdict — structured to match how architects and finance teams actually evaluate migration decisions separately before combining them.
- Full Execution Platform Cost Modeling: Serverless cost is not modeled as a flat invocation rate. The calculator separates Lambda invocations, compute duration (memory class × execution time), and platform overhead at three tiers — Minimal, Standard, and Enterprise — so the comparison is defensible in a budget conversation.
- Refactoring Cliff Index (RCI) — Framework #130: A 0–100 composite of economic pressure and migration complexity, positioned on the three-stage Refactoring Cliff Model. The stage rail shows where your LCNC deployment sits on the Velocity → Friction → Cliff continuum.
- Five-Year Avoidable Spend: The cumulative licensing cost minus projected execution platform cost over five years, compounded at your selected growth profile. The number executives and finance teams need to authorize a migration program.
- Client-Side Only: No data leaves the browser. No telemetry, no server-side logging, no account required. All scoring logic runs locally in your browser session.
THE RCI SURFACES THE PRESSURE.
A REVIEW DETERMINES THE PROGRAM.
The calculator tells you where you are on the cliff. A structured review determines the migration sequence, phase boundaries, and the governance model that keeps the refactored platform from accumulating the same debt.
|
>_ Architectural Guidance
Infrastructure Architecture ReviewA structured review maps the LCNC dependency graph, validates the RCI signal against production architecture, and produces the migration sequencing plan.
|
>_ The Dispatch
Architecture Playbooks. Field-Tested Blueprints.Infrastructure decision frameworks for architects navigating platform economics, migration sequencing, and cloud cost governance.
Zero spam. Unsubscribe anytime. |
Frequently Asked Questions
Q: What does the Refactoring Cliff Calculator actually measure?
A: Three things, independently. The Economic Cliff Score measures financial pressure — whether your LCNC licensing model is becoming economically irrational relative to a native serverless baseline. The Migration Complexity Score measures how difficult migration would actually be, based on platform lock-in, workflow criticality, API coupling, and compliance requirements. The Refactoring Cliff Index combines both into a composite score that positions your deployment on the three-stage Refactoring Cliff Model framework.
Q: How is this different from a standard LCNC vs serverless cost calculator?
A: Standard calculators compare seat cost against Lambda invocation cost and stop there. This tool models the full execution platform cost — invocations, compute duration, and platform overhead at three tiers — and weighs it against the actual migration complexity, not just the price delta. A vacation request portal and a revenue-critical claims processing workflow should not receive the same recommendation even if their licensing costs are identical. This calculator accounts for that distinction through the Migration Complexity Score and the 2×2 verdict matrix.
Q: What is the Refactoring Cliff Model framework?
A: Framework #130 in the Rack2Cloud named framework corpus. It describes three stages of LCNC platform adoption: Velocity, where rapid delivery exceeds technical burden; Friction, where operational complexity grows faster than platform value; and Cliff, where refactoring economics favor migration. The stage rail in the calculator maps your Refactoring Cliff Index score to a live position on that continuum.
Q: What does the five-year avoidable spend number represent?
A: The cumulative LCNC licensing cost minus the projected execution platform cost over five years, compounded at your selected growth profile. Both sides grow — user count and execution volume increase on the LCNC side, while the serverless side scales with execution growth. This number is what belongs in a migration program business case. Monthly savings figures rarely authorize a migration. A $400,000 five-year exposure figure does.
Q: Is any data sent to a server or stored?
A: No. All calculation logic runs entirely in your local browser session. No inputs, results, or usage data are transmitted, logged, or stored server-side. No account is required.
🔒 Privacy Architecture: No cookies. No tracking pixels. No server-side database.
This logic runs entirely in your local browser session.