

Architectural diagnostics, capacity analysis, placement economics and control-plane intelligence for modern AI infrastructure.
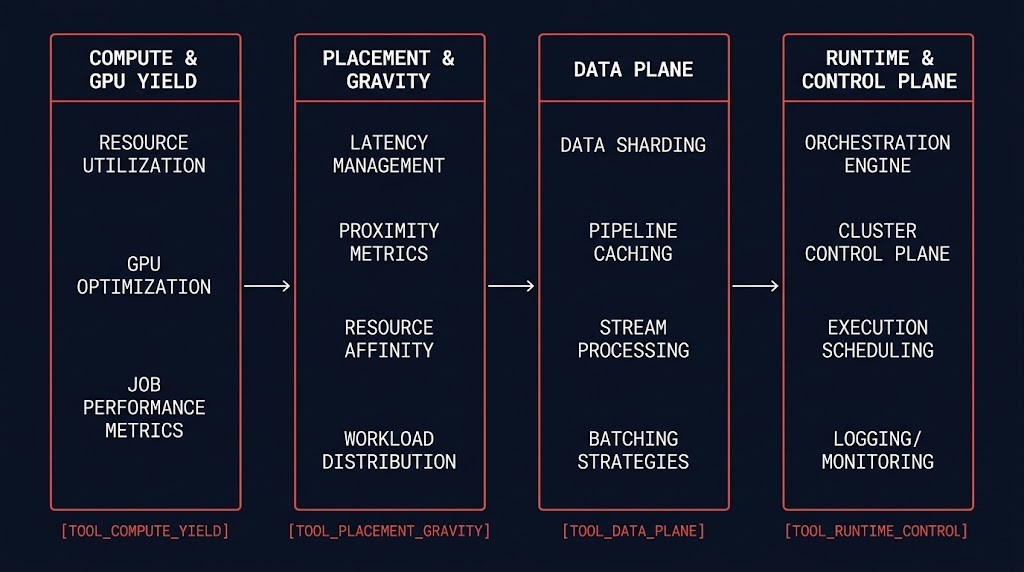
Five structural failure states that define AI infrastructure operational risk. Each originates in one systems plane and compounds into others when left undiagnosed.
| Failure State | Operational Outcome |
|---|---|
| Capacity Illusion | GPUs appear constrained despite idle capacity — fragmentation and yield loss mask recoverable compute |
| Placement Drift | Workloads execute on economically and architecturally incorrect substrates — cost and latency penalties accumulate silently |
| Data-Layer Saturation | Storage throughput becomes the hidden bottleneck — misread as compute insufficiency until the data plane is independently characterized |
| Fabric Pressure | East-west bandwidth saturation and all-reduce contention manifest as compute or runtime failures — the fabric constraint is invisible until the interconnect topology is independently characterized |
| Runtime Collapse | Inference latency amplifies under concurrency — KV-cache exhaustion and token queue amplification manifest as model load rather than infrastructure saturation |
| Authority Fragmentation | Placement, routing, and economics become disconnected — no single owner has visibility across all planes simultaneously. When inference execution authority is undefined, Runtime Authority Vacuum exists regardless of operational maturity. Diagnosed by the AI Runtime Governance Analyzer. |
Most AI infrastructure failures originate in one plane and compound into another. The Engineering Workbench decomposes these failure states into independent diagnostic layers — each tool surfaces a different structural condition, and the cross-tool interpretation paths surface compound failures that no single diagnostic can see alone.
>_ Operational Phase 01 Compute & GPU Yield Analysis
GPU Utilization & AI Capacity Analyzer
Surfaces Effective GPU Yield — the true denominator for cost-per-unit-work — by discounting provisioned capacity for allocation drift, fragmentation, and real utilization. Diagnoses Phantom Scarcity, Queue–Idle Paradox, Capacity Illusion Index, and Economic Density Loss. The entry point for any AI infrastructure cost or capacity investigation.
GPU yield analysis surfaces what capacity is actually available for workloads — not what the provisioning dashboard reports. The physics constraints that set that ceiling — VRAM capacity, memory locality, and interconnect topology — are defined at the accelerated compute architecture layer, before scheduling or fragmentation enter the picture. Knowing the effective yield answers the first diagnostic question. It does not answer whether workloads are landing on the correct substrate given their latency class, compute weight, and cost tier. That is the placement question.
>_ Operational Phase 02 Placement & Gravity Analysis
AI Gravity & Placement Engine
Models workload gravity and substrate selection — matching AI workloads to infrastructure substrates based on latency class, compute weight, sovereignty constraints, and Token TCO. Surfaces Placement Drift before it accumulates as invisible cost and latency penalties. The diagnostic layer between yield analysis and runtime saturation.
Placement analysis determines which substrate a workload belongs on. It cannot tell you whether the data plane supporting that substrate can sustain the serving path under load. Storage throughput is the hidden third variable — the constraint that surfaces after placement is resolved and concurrency scales.
>_ Operational Phase 03 Data Plane Analysis
AI Ceph Throughput Calculator
Characterizes Ceph storage throughput for AI workloads — object store bandwidth, RADOS bottleneck modeling, and throughput ceiling analysis under AI serving load. Surfaces Data-Layer Saturation before it is misdiagnosed as compute insufficiency. Covers the data infrastructure foundation for model serving, vector retrieval, and checkpoint storage. The first tool in the data plane — additional tools for vector stores, object storage, and retrieval infrastructure are on the roadmap.
Storage throughput analysis surfaces the data-layer ceiling. The fabric layer sits between the data plane and the runtime — east-west bandwidth saturation and collective communication contention are constraints that storage throughput analysis cannot see alone. When storage looks healthy but distributed workloads are still degrading under load, the interconnect topology is the next diagnostic surface.
>_ Operational Phase 04 Fabric & East-West Analysis
AI Fabric Pressure Analyzer
Surfaces east-west bandwidth saturation and fabric pressure across distributed AI workloads — modeling all-reduce contention, RoCE congestion thresholds, and topology mismatch under collective communication load. Produces the East-West Pressure Index and identifies fabric archetypes from Balanced Fabric through Fabric Saturated. The diagnostic layer between data plane throughput and runtime saturation where interconnect topology becomes a first-class placement input.
>_ Operational Phase 05 Runtime & Control Plane Analysis
Fabric pressure analysis surfaces east-west congestion and topology constraints that neither compute yield nor storage throughput tooling can see directly. A fabric saturation condition will accelerate runtime collapse under concurrency — the KV-cache exhaustion and token queue amplification that the runtime layer surfaces are often the downstream signal of a fabric constraint that was never characterized upstream.
>_ Operational Phase 06 Governance & Authority Analysis
AI Runtime Governance Analyzer
Surfaces authority fragmentation across seven governance domains — runtime operations, policy authority, deployment authority, policy enforcement, incident response, observability ownership, and inference execution authority. Scores Governance Authority Rating, Operational Fragmentation Score, Runtime Control Concentration, Observability Authority Exposure, and Governance Drift Risk. Fires Runtime Authority Vacuum unconditionally when no group holds inference execution authority — independent of all other inputs. The diagnostic that answers whether the infrastructure is governed, not just operated.
Governance authority analysis surfaces whether the infrastructure has a defined authority model for execution decisions — who can deny, halt, throttle, or restrict inference workloads. The tools below this layer answer whether the infrastructure is working. ARGA answers who is authorized to act when it isn’t. Together, the five compute-through-governance diagnostic layers surface where the AI infrastructure stack is exposed before a production incident makes the gap visible. The survivability layer — DISE — models what happens when those authority decisions cannot be made in time.
AI Inference Saturation Analyzer
Surfaces the Interaction Collapse Point — the concurrency threshold where token queue amplification, KV-cache exhaustion, and TTFT/TPOT degradation compound into serving collapse. Diagnoses Throughput Illusion, maps the queue amplification curve, and characterizes runtime governance gaps where routing and execution authority are disconnected from infrastructure telemetry.
Distributed Inference Survivability Engine
Evaluates the complete inference dependency chain — routing, gateway, tokenizer, vector DB, model registry, and scheduler — and scores how many critical execution paths remain intact under partial failure. Surfaces the Inference Survivability Signal, the Inference Degradation Ladder, and the Survivability Illusion condition when replica count overstates actual service resilience. Framework #124 — AI Inference Survivability Chain.
AI Cost Density & Governance Engine
Will surface Economic Density Loss across the inference portfolio — the gap between provisioned accelerator spend and effective compute work delivered. Governance-layer analysis: not just what AI infrastructure costs, but whether the authority structure exists to change it. The question shifts from “Can I run inference?” to “Should this inference still be running here?”
AI infrastructure failures rarely terminate at the plane where they originate. Each unresolved condition creates the conditions for the next.
| Initial Condition | Escalation Path |
|---|---|
| Phantom Scarcity | → Capacity procurement triggered before yield recovery is attempted → infrastructure cost increases without resolving the underlying fragmentation |
| Capacity Illusion | → Placement decisions made on false capacity baseline → workloads assigned to substrates already operating at effective yield ceiling → queue depth masked as model latency |
| Locality Collapse | → Inference spillover to provider API → sovereignty boundary traversal and egress amplification → cost anomalies not traceable to request volume → application layer registers success |
| Throughput Illusion | → KV-cache exhaustion masked by aggregate throughput metric → serving capacity overstated until saturation is complete → Interaction Collapse Point crossed without warning |
| Interaction Collapse Point | → Token queue amplification → concurrent request backlog grows faster than serving throughput → TTFT/TPOT degradation cascades across all active sessions → system presents as overloaded when root cause is concurrency governance failure |
| Storage Throughput Cliff | → Data layer becomes serving bottleneck → misdiagnosed as GPU insufficiency → compute provisioning increases without resolving storage constraint → KV-cache starvation accelerates runtime saturation |
| Fabric Saturation | → East-west bandwidth ceiling reached under collective communication load → all-reduce contention stalls distributed training and inference → misread as compute or storage insufficiency → runtime saturation accelerates as fabric pressure compounds serving latency |
| Inference Residency Creep | → Endpoint portfolio grows without formal audit → permanent serving floor rises → serving infrastructure scales with endpoint count, not request volume → aggregate cost grows without corresponding capacity authorization |
Named failure patterns that appear across AI infrastructure failures. Each represents a structural condition, not an operational mistake.
Perceived GPU shortage produced by recoverable yield loss rather than genuine demand. The condition where an organization queues for capacity while simultaneously wasting significant provisioned yield.
The loss of topology-aware execution locality caused by routing systems that optimize for endpoint availability rather than infrastructure placement efficiency — producing invisible sovereignty leakage and egress amplification.
Simultaneous queued jobs and idle allocated GPUs — a scheduling and fragmentation failure, not a capacity shortage. The condition that makes Phantom Scarcity structurally undetectable without yield-layer instrumentation.
Stranded fraction of each GPU card produced by whole-card allocation to workloads that require only a fraction of the card’s compute or memory capacity. The primary mechanical driver of Effective GPU Yield collapse.
The gap between reported token throughput and sustainable serving capacity under concurrency load. A saturation artifact — aggregate throughput metrics remain stable while per-session degradation accumulates toward the Interaction Collapse Point.
East-west bandwidth saturation misread as compute or storage insufficiency — the fabric constraint is invisible to utilization dashboards that instrument individual nodes but do not characterize the interconnect topology under collective communication load.
Steadily growing inference infrastructure footprint produced by new model deployments that add permanent serving overhead without retiring prior endpoint costs. Each addition is individually justified; the aggregate grows without a natural ceiling.
Tool output is most useful when it triggers the next analysis. These paths map signal to next diagnostic step across the AI infrastructure systems planes.
| If This Tool Detects | Run Next | Why |
|---|---|---|
| GPU Utilization & AI Capacity Analyzer — Phantom Scarcity signal: yield below threshold despite provisioned capacity | → AI Gravity & Placement Engine | Determine whether workloads are landing on substrates that don’t match their compute weight class — placement mismatch is the primary non-fragmentation driver of yield degradation |
| AI Gravity & Placement Engine — gravity miscalculation: workloads executing on economically incorrect substrate | → AI Inference Saturation Analyzer | Confirm whether runtime saturation is the root cause of the apparent placement penalty — a substrate that looks wrong on gravity modeling may be running at its Interaction Collapse Point |
| AI Inference Saturation Analyzer — Interaction Collapse Point reached: concurrent token load exceeds KV-cache capacity | → GPU Utilization & AI Capacity Analyzer | Determine if collapse is yield-driven (recoverable via fragmentation reduction) or represents a genuine demand ceiling requiring additional capacity authorization |
| AI Inference Saturation Analyzer — saturation signal not tracking compute load: latency degrading faster than concurrency growth predicts | → AI Fabric Pressure Analyzer | Determine whether east-west bandwidth saturation or all-reduce contention is the upstream constraint — fabric pressure accelerates runtime saturation in distributed architectures where the serving path crosses interconnect topology boundaries |
| AI Fabric Pressure Analyzer — East-West Pressure Index elevated: fabric saturation risk confirmed under collective communication load | → AI Inference Saturation Analyzer | Confirm whether runtime serving is already degrading as a downstream effect of fabric pressure — the Interaction Collapse Point may be closer than concurrency metrics indicate when the fabric layer is constrained |
| AI Ceph Throughput Calculator — storage throughput ceiling: data layer saturating before compute | → AI Inference Saturation Analyzer | Confirm whether KV-cache saturation is the compounding constraint — a storage throughput ceiling accelerates runtime saturation in serving architectures where the token cache depends on object storage |
| AI Gravity & Placement Engine — predicted placement penalty: gravity mismatch under increasing load | → AI Ceph Throughput Calculator | Validate whether data locality and storage throughput are driving the placement penalty — a workload that belongs on a different substrate may be penalized by data proximity constraints, not compute weight alone |
| AI Inference Saturation Analyzer — governance gaps flagged: routing and execution authority disconnected from infrastructure telemetry | → AI Runtime Governance Analyzer | Determine whether authority fragmentation is the root cause of the governance gap — saturation events that no authority model governs are Runtime Authority Vacuum indicators at the execution layer |
Operational characteristics at each maturity level. The tools above map to the transitions between levels — not to a single maturity state.
| Maturity Level | Operational Characteristic |
|---|---|
| Foundation | Single-substrate GPU serving with no placement governance. Utilization unmeasured or monitored only at the provisioning layer. Storage throughput uncharacterized per workload class. AI infrastructure cost attributed as undivided spend with no model-level visibility. |
| Operational | Multi-substrate awareness emerging. GPU yield and utilization instrumented at the cluster level. Storage throughput characterized per workload class. Placement decisions made manually by the platform team without formal substrate assignment criteria. |
| Strategic | Placement decisions governed at the infrastructure layer with defined substrate assignment criteria. Yield, saturation, storage throughput, and fabric pressure analyzed in combination. Cost attribution reaches the model level — residency floor visible per endpoint. |
| Resilient | Cross-plane failure patterns mapped. Runtime degradation path defined and monitored. Interaction Collapse Points identified per serving endpoint. Fabric saturation thresholds characterized per topology. Survivability modeled against concurrent plane degradation — the system has a defined failure envelope. |
| Sovereign | Full control-plane authority over inference execution, placement, cost attribution, and operational governance. Authority fragmentation eliminated — each infrastructure plane has a defined owner, defined escalation path, and defined policy boundary. Residency Creep governed by formal endpoint lifecycle process. |
| Autonomous | Placement, capacity allocation, runtime routing, and economic optimization operate from a unified infrastructure control plane. Governance decisions are infrastructure-enforced, not team-negotiated. The system manages its own placement, yield recovery, and cost density without manual arbitration at each decision point. |
YOU’VE RUN THE DIAGNOSTICS.
NOW UNDERSTAND WHAT THE FINDINGS MEAN FOR YOUR ARCHITECTURE.
Tool outputs surface the signals. An architecture engagement maps them to decisions — placement authority, residency governance, and the control plane gaps that diagnostics alone cannot close.
Work With The Architect — AI Infrastructure
Engagement covering AI infrastructure placement governance, yield recovery, runtime saturation analysis, and control plane authority gaps.
- > Placement authority and substrate governance review
- > GPU yield recovery path and fragmentation analysis
- > Inference residency cost model and endpoint audit
- > Control plane ownership and escalation path mapping
Architecture Playbooks. Field-Tested Blueprints.
AI infrastructure architecture playbooks covering placement governance, yield recovery, and inference cost models.
- > GPU yield recovery and fragmentation patterns
- > Inference placement authority migration
- > Residency cost governance models
- > Runtime saturation and KV-cache ceiling management
Zero spam. Unsubscribe anytime.