GPU Utilization & AI Capacity Analyzer
Surface Effective GPU Yield, Capacity Illusion Index, and Phantom Scarcity — the architectural signals your monitoring dashboard does not show.
Your GPU monitoring dashboard already shows utilization percent. It shows memory utilization, queue depth, and active job count. None of that is the problem.
The problem is that those numbers are operationally misleading. GPU utilization percent measures what allocated GPUs are doing during active compute cycles. It does not measure allocation drift — the fraction of provisioned GPUs allocated to workloads that are idle. It does not measure fragmentation tax — the stranded capacity produced when whole-GPU jobs run on hardware that could serve four concurrent sub-GPU workloads. It does not measure whether a persistent job queue exists alongside idle allocated capacity. An organization with 62% average utilization, a 20-job queue, and a constant GPU shortage narrative may have an Effective GPU Yield of 31% — and the delta between those two numbers is entirely recoverable without adding hardware.
The GPU Utilization & AI Capacity Analyzer is built on that distinction. It evaluates utilization credibility — not whether GPUs are busy during active cycles, but whether provisioned accelerator capacity is actually available for useful work. The frameworks it applies — yield, fragmentation, phantom scarcity — are architectural concepts grounded in accelerator compute physics, not monitoring heuristics.
What the Analyzer Evaluates
Layer 01 — Yield Analysis
Effective GPU Yield — provisioned capacity discounted by allocation drift, real utilization, and fragmentation. The Capacity Illusion Index and Phantom Scarcity detection surface whether perceived GPU shortage is structural or genuine. When yield analysis returns healthy across all four layers and throughput constraints persist, fabric pressure is the next diagnostic layer — the AI Fabric Pressure Analyzer surfaces whether east-west congestion is constraining effective compute throughput upstream of the workload layer.
Layer 02 — Allocation Reality
Allocation–Utilization Gap and Queue–Idle Paradox detection. The gap between capacity allocated to workloads and the compute those workloads are actually consuming is where the yield loss lives — and it is invisible to standard monitoring.
Layer 03 — Fragmentation & Scheduling
Fragmentation Tax, Scheduler Maturity Signal, and orphaned allocation quantification. Scheduling immaturity is the root cause most teams misattribute to hardware shortage. The analyzer surfaces it as an explicit output, not a buried input.
Layer 04 — Commitment Structure
Reservation Overhang, Economic Density Loss, and Inference Persistence Signal. Committed GPU capacity that outlives the workloads that justified it is a compounding cost obligation. The Inference Persistence Signal routes to the Cloud Repatriation Economics Engine when persistent inference may amortize better on dedicated infrastructure.
GPU Yield Efficiency Signal
The analyzer’s primary output is a named yield classification — not a score. Four tiers:
Effective yield is critically low. A large fraction of provisioned accelerator capacity is not converting to usable compute work. Economic Density Loss is likely substantial. The gap between provisioned spend and productive output is the dominant operational problem.
Real waste from fragmentation, scheduling failure, or reservation overhang — largely recoverable without fleet expansion. The waste is operational, not physical. The Recoverable Capacity output quantifies what can be reclaimed.
Fleet efficiency is broadly acceptable but headroom exists. Targeted scheduler improvements or allocation right-sizing would improve effective yield without infrastructure change.
Provisioning, allocation, and demand are well-matched at current inputs. Capacity pressure reflects genuine demand. This is the correct signal for a well-governed fleet. When capacity becomes constrained at this yield level, expansion is genuinely justified.
The Yield Alignment Achieved tier carries equal weight to the failure tiers. A tool that always surfaces waste is not an analysis tool — it is advocacy. When the fleet is genuinely well-governed, the analyzer says so. That neutrality is what makes the failure signals credible when they fire.
Output Architecture
Fourteen outputs in a fixed three-block sequence — recognition first, explanation second, economics and path third.
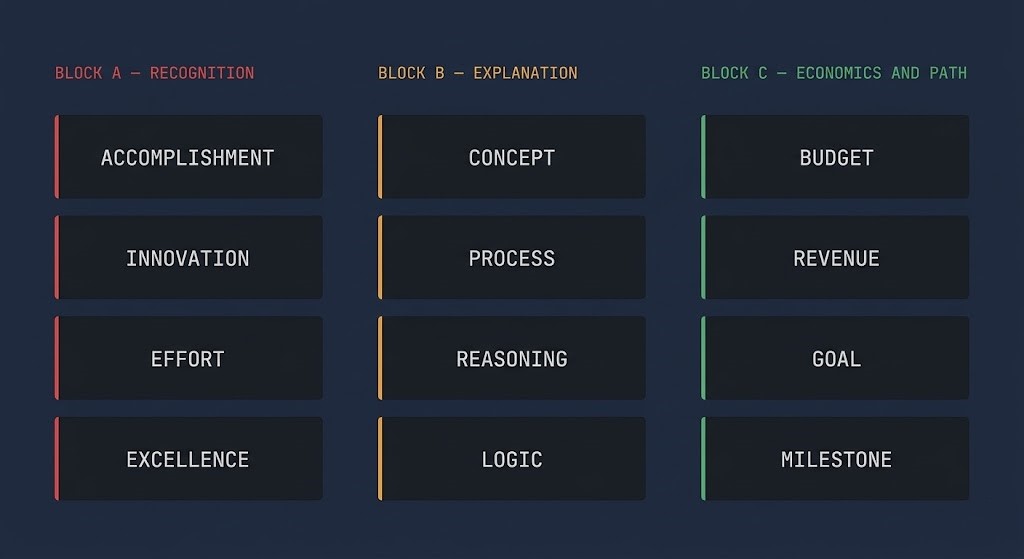
| Output | What It Surfaces |
|---|---|
| Yield Reframe | Side-by-side: Average GPU Utilization % vs Effective GPU Yield % — the number that matters alongside the number that misleads |
| GPU Yield Efficiency Signal | Primary classification: Severe Yield Collapse / Structural Yield Loss / Yield Optimization Margin / Yield Alignment Achieved |
| Phantom Scarcity Detection | Detected / Partial / Not Detected — whether perceived GPU shortage is structural or reflects genuine demand |
| Capacity Illusion Index | % of provisioned capacity operationally unavailable — with Artificial / Mixed / Credible Scarcity interpretation and quantified GPU count breakdown |
| First Waste Driver | The single architectural sentence identifying the primary yield loss mechanism at current inputs |
| Queue–Idle Paradox | Detected with quantified idle % alongside queue depth — or cleared. The signature of scheduling failure misread as capacity shortage |
| Yield Loss Composition | Three-line decomposition: Allocation–Utilization Gap · Fragmentation Tax · Reservation Overhang |
| Scheduler Maturity | Primitive / Transitional / Density-Aware / Yield-Optimized — the root-cause layer most capacity conversations skip |
| Economic Density Loss | $/mo and annualized provisioned GPU spend not converting to effective compute work |
| Recoverable Capacity | % and GPU count reclaimable through operational changes without adding hardware |
| Yield Recovery Horizon | Derived interpretation: how many months recoverable yield could offset projected fleet expansion requirements at current growth rate |
| Inference Persistence Signal | Persistent / Mixed / Elastic — drives cross-tool routing to the Cloud Repatriation Economics Engine for persistent inference economics |
| Remediation Path | Ordered action sequence calibrated to inputs: Re-architect Scheduling → Consolidate → Rightsize Reservation → Repatriate Persistent Inference → Shed Burst to Spot → Implement Fractionalization |
| AI Capacity Operating Pattern | Workload archetype name + 2-paragraph architectural interpretation of yield risk and primary failure mode |
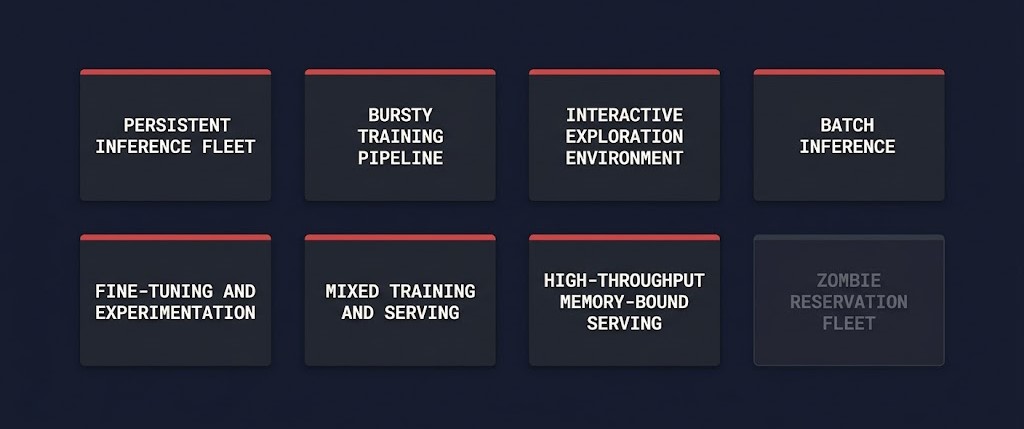
AI Capacity Operating Patterns
Section 2.5 maps inputs to one of eight named operating patterns. The pattern drives Yield Loss Composition weighting, Phantom Scarcity scoring, and the cross-tool routing logic. Each carries a distinct failure signature — from notebook sprawl in the Interactive Exploration Environment to the organizational inertia that sustains a Zombie Reservation Fleet.
| Operating Pattern | Primary Yield Risk |
|---|---|
| Persistent Inference Fleet | Reservation Overhang accumulation; continuous demand is a strong repatriation candidate — run the Cloud Repatriation Economics Engine for the full economic model |
| Bursty Training Pipeline | Allocation-holds between training runs; reservation over-commitment at peak demand levels |
| Interactive Exploration Environment | Notebook sprawl — highest Allocation–Utilization Gap of any archetype; idle cards held by sessions that are not computing |
| Batch Inference / Scheduled | Idle GPUs between scheduled windows; scheduler bin-packing is the primary yield lever |
| Fine-Tuning / Experimentation | Capacity accumulates faster than it releases across experiment cycles; Reservation Overhang compounds |
| Mixed Training + Serving (Shared Cluster) | The Queue–Idle Paradox epicenter — training jobs hold allocations while inference underutilizes its share; workload class isolation is the fix |
| High-Throughput Memory-Bound Serving | Compute utilization % is genuinely misleading — memory bus saturation at low compute utilization is a hardware class mismatch problem |
| Zombie Reservation Fleet | Committed capacity that outlived its workloads; Economic Persistence Bias sustains commitments that releasing would “feel” costly |
The Mixed Training + Serving pattern is where the Queue–Idle Paradox appears most consistently. These shared clusters carry training jobs holding large GPU allocations and inference serving underutilizing its share simultaneously — the scheduler sees both as occupied and queues new work. The organization reads the queue as a capacity shortage. The analyzer reads it as a scheduling architecture problem. More GPUs without workload class isolation will reproduce the paradox at larger scale.
Named Frameworks
Six architectural frameworks underpin the analyzer’s output logic and are applied directly to the yield calculations:
| Framework | Definition |
|---|---|
| Effective GPU Yield | Provisioned accelerator capacity discounted by allocation drift, real utilization, and fragmentation — the true denominator for cost-per-unit-work |
| Capacity Illusion Index | The delta between provisioned GPU perception and effective usable yield — scarcity that is architectural, not physical |
| Phantom Scarcity | Perceived GPU shortage produced by recoverable yield loss rather than genuine demand — organizations queue for capacity while wasting provisioned yield |
| Queue–Idle Paradox | Simultaneous queued jobs and idle allocated GPUs — a scheduling and fragmentation failure, not a capacity shortage |
| Fragmentation Tax | Stranded fraction of each GPU from whole-card allocation to sub-card workloads that require only a fraction of the card’s compute or memory capacity |
| Economic Density Loss | Provisioned accelerator spend that fails to convert into effective compute work — the CFO-readable translation of yield collapse |
The Accelerator Layer of the Cloud Cost Governance Toolkit
The GPU Utilization & AI Capacity Analyzer is the fifth and final layer of the Cloud Cost Governance diagnostic chain — and the layer that brings the governance spine into the AI era. Each tool in the chain surfaces a distinct failure mode; this one surfaces the failure mode that is most urgently misidentified as a hardware shortage:
AI Infrastructure Operational Stack
| Layer | Tool |
|---|---|
| Idle infrastructure drift | Cloud Idle Resource Analyzer |
| Kubernetes density collapse | Kubernetes Cost Density Calculator |
| Sovereignty and control-plane exposure | Shadow Sovereignty Auditor |
| Repatriation economics | Cloud Repatriation Economics Engine |
| Accelerator yield collapse | GPU Utilization & AI Capacity Analyzer |
GPU Utilization Analyzer: Key Features
- GPU Yield Efficiency Signal: Four named classification tiers — Severe Yield Collapse, Structural Yield Loss, Yield Optimization Margin, and Yield Alignment Achieved. The primary output is a named architectural verdict. Yield Alignment Achieved fires when the fleet is genuinely well-governed — the tool is operationally neutral by design. A GPU utilization analyzer that always surfaces waste is advocacy, not analysis.
- Capacity Illusion Index: The delta between provisioned GPU perception and effective usable yield — expressed as a percentage with a quantified GPU count breakdown. This is the number that makes the conversation: 512 GPUs provisioned, 171 effective, Capacity Illusion Index 66%. The accompanying interpretation classifies the scarcity as Artificial, Mixed, or Credible.
- Phantom Scarcity Detection: Surfaces whether a persistent job queue coexists with recoverable yield loss. The detection carries a specific architectural sentence: queued workloads alongside allocatable but idle capacity is a scheduling failure, not a hardware gap. Adding GPUs without addressing the root cause reproduces the paradox at larger scale.
- Yield Recovery Horizon: A single derived interpretation line beneath Recoverable Capacity — how many months current recoverable yield could offset projected GPU expansion requirements at current fleet growth rate. Reframes “you have waste” into “you may not need to buy more GPUs yet.” No extra card. One architectural sentence.
- Client-Side Only: No data leaves the browser. No telemetry, no server-side logging, no account required. The analyzer runs entirely in the local browser session against your inputs.
THE ANALYZER SURFACES THE YIELD SIGNAL.
A REVIEW MAPS IT TO YOUR FLEET.
The yield signal names the architectural verdict. A cost architecture review translates it into a sequenced action plan — mapped against your commitment window, scheduler maturity, and workload profile.
|
>_ Architectural Guidance
Cost Architecture ReviewStructured review of your GPU fleet economics and yield signal against your actual commitment structure and workload profile.
|
>_ The Dispatch
Architecture Playbooks. Field-Tested Blueprints.GPU governance, AI infrastructure cost patterns, and accelerator capacity architecture — delivered as field-tested operational blueprints.
Zero spam. Unsubscribe anytime. |
Frequently Asked Questions
Q: What does the GPU Utilization Analyzer actually measure?
A: The analyzer takes fleet inventory, commitment structure, workload profile, allocation signals, and fragmentation inputs — and returns an architectural yield assessment across four layers: Yield Analysis, Allocation Reality, Fragmentation and Scheduling, and Commitment Structure. It does not connect to your GPU infrastructure, read telemetry, or require monitoring access. The output is deterministic — the same inputs produce the same analysis every run.
Q: How is this different from a GPU monitoring dashboard or FinOps tool?
A: GPU monitoring dashboards show utilization percent, memory utilization, queue depth, and active job counts. FinOps tools quantify spend in dollar terms. This analyzer evaluates whether the utilization numbers your dashboard shows are credible — whether provisioned GPU capacity is actually available for useful work, or whether Phantom Scarcity is producing the appearance of a hardware shortage from operational inefficiency. The primary output is a named Yield Efficiency Signal, not a metric.
Q: What does Yield Alignment Achieved mean?
A: Yield Alignment Achieved is one of four GPU Yield Efficiency Signal tiers. It fires when provisioning, allocation, and demand are well-matched at current inputs — capacity pressure reflects genuine demand rather than recoverable waste. It is not a failure state. It is the correct output for a well-governed fleet. When capacity becomes constrained at this yield level, expansion is genuinely justified. The analyzer is operationally neutral by design — a GPU utilization tool that always surfaces waste is advocacy, not analysis.
Q: What is the Queue–Idle Paradox and why does it matter?
A: The Queue–Idle Paradox fires when persistent queued workloads coexist with idle allocated GPU capacity. Jobs are waiting for GPUs that are technically allocated but not performing useful compute work — because of orphaned allocations, scheduling immaturity, or whole-GPU allocation to sub-GPU workloads. The paradox matters because organizations typically read a job queue as a hardware shortage and respond by adding GPUs. Adding GPUs without addressing the scheduling root cause reproduces the paradox at larger scale.
Q: What is the Yield Recovery Horizon?
A: The Yield Recovery Horizon is a single derived interpretation line beneath the Recoverable Capacity output. It expresses how many months current recoverable yield could offset projected GPU fleet expansion requirements at the current growth rate. It is not a guarantee — it is an architectural directional signal that reframes ‘you have waste’ into ‘you may not need to buy more GPUs yet.’ It degrades gracefully: if fleet growth rate inputs are absent, the line suppresses rather than estimating.
🔒 Privacy Architecture: No cookies. No tracking pixels. No server-side database.
This logic runs entirely in your local browser session.