Recovery Readiness Analyzer
Confidence Multiplier · Validated Readiness Tier · Primary Constraint · Recovery Scenario
Most recovery readiness assessments measure backup hygiene — coverage percentages, job success rates, the date of the last test — and present that as recovery confidence. Those numbers describe whether backups ran. They say almost nothing about whether the organization could execute the recovery it would actually need during a real incident, in the order systems must come back, while production cannot be trusted.
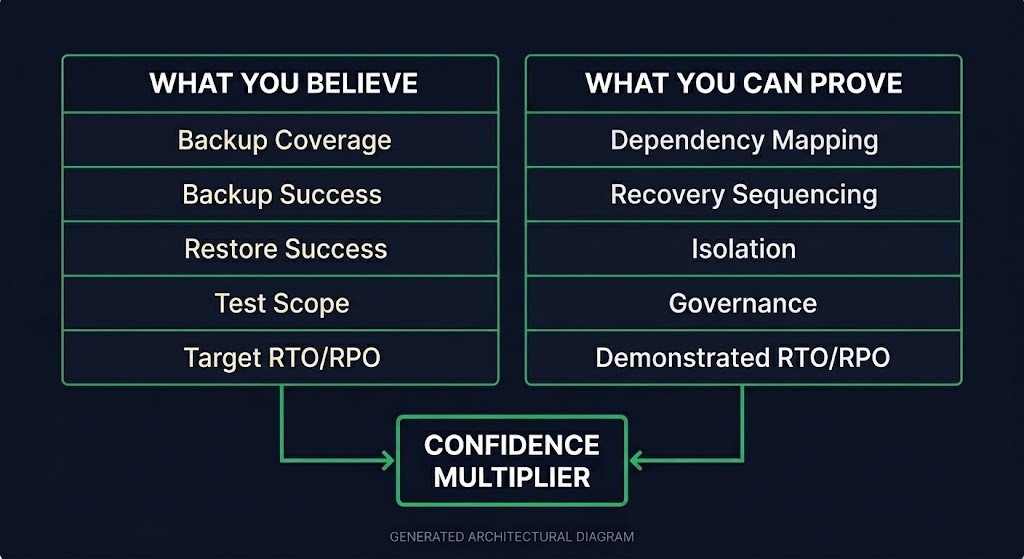
The Recovery Readiness Analyzer separates those two questions deliberately. One section — Reported Recovery Confidence — captures the operational indicators most scorecards already track: backup coverage, restore testing, documented RTO/RPO targets. A second section — Validated Recovery Readiness — asks for evidence: dependency mapping, recovery sequencing, isolation from a compromised production environment, governance, and demonstrated recovery times. The relationship between those two scores, expressed as a Confidence Multiplier, is the finding. A 2.1× multiplier means an organization believes it is more than twice as recoverable as its evidence supports — and that gap is where recovery plans actually fail.
This is one piece of the broader Data Protection Architecture discipline. For the isolation failures that widen this gap in practice, see Your Backup System Is Part of the Blast Radius.
What the Recovery Readiness Analyzer Surfaces
What You Believe — Reported Recovery Confidence
Backup coverage and success rate, restore success history, the scope and fidelity of your most rigorous recovery test, and your documented RTO/RPO targets. These are the indicators most organizations already report — and the ones that create false confidence when treated as the whole picture.
What You Can Prove — Validated Recovery Readiness
Dependency mapping, recovery run-order, isolation from a compromised production environment (clean-room recovery, identity separation, credential independence, immutable copies), recovery governance, and the recovery time you’ve actually demonstrated — not just targeted.
The Confidence Multiplier
A single ratio — Reported Confidence ÷ Validated Readiness — that quantifies the gap between what you believe and what you’ve demonstrated. Paired with a Primary Constraint, a Validated Readiness Tier, and a plain-language scenario describing the most likely point of failure if recovery started today.
Tiers apply to Validated Readiness only. Reported Confidence is shown as a number — not a tier — so the analyzer doesn’t imply two competing maturity scales. The tier tells you how far Validated Readiness has progressed; the multiplier tells you how far Reported Confidence has drifted from it.
| Tier | Validated Readiness Score | Meaning |
|---|---|---|
| Illusory | 0–29 | Reported confidence is almost entirely unsupported by evidence |
| Fragile | 30–54 | Some capability demonstrated, but major gaps remain in architecture, sequencing, isolation, or governance |
| Provisional | 55–79 | Core capability is demonstrated; gaps are specific and addressable |
| Validated | 80–100 | Recovery capability is demonstrated across architecture, sequencing, isolation, and governance |
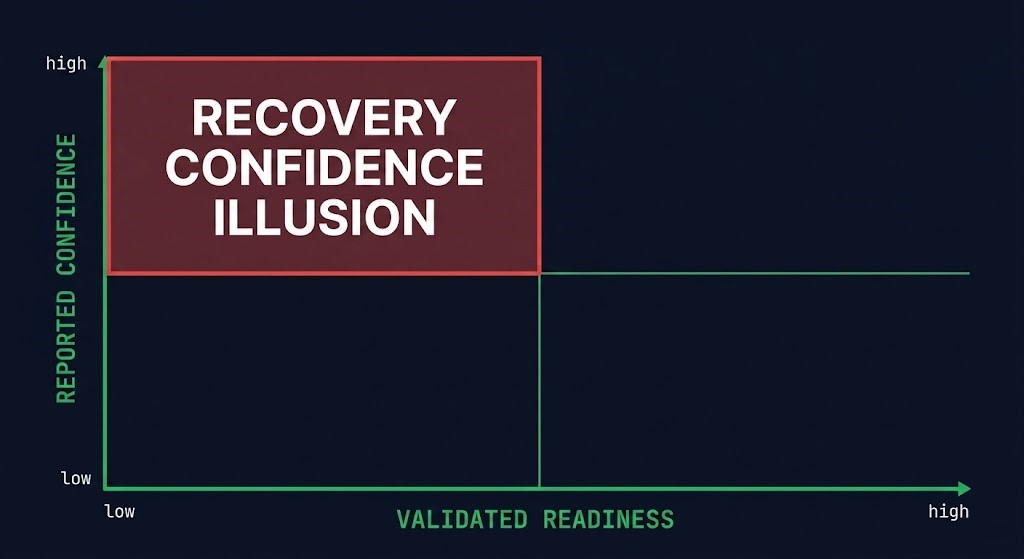
Recovery Confidence Illusion
The analyzer surfaces one named failure state — Recovery Confidence Illusion — when Reported Confidence is 65 or higher and Validated Readiness is below 50. The interpretation is direct: the organization is confident it can restore systems, but has not demonstrated it can restore business operations. This is the result executives recognize immediately, because it reframes “we’re covered” as a claim that hasn’t been tested against the conditions of a real incident — identity compromise, unknown recovery order, no isolated environment to recover into.
The failure state is only shown when triggered. If your scores don’t meet the condition, the analyzer doesn’t display it — a result that’s absent by design, not by omission.
Recovery Readiness Analyzer: Key Features
- Two-Section Asymmetric Diagnostic: “What You Believe” is short — sliders and a handful of selects. “What You Can Prove” is longer — categorical assessments across five capability domains. The asymmetry in effort mirrors the real asymmetry between claiming recovery confidence and demonstrating recovery readiness.
- Confidence Multiplier: A single ratio quantifying how far reported confidence exceeds (or falls short of) validated readiness — the headline result, not a buried sub-score.
- Recovery Confidence Illusion Detection: The named failure state fires only when high reported confidence pairs with low validated readiness — shown only when triggered, never as decoration.
- If Recovery Started Today — Scenario Output: The Primary Constraint is translated into a plain-language scenario describing the most likely point of failure — architects and executives remember scenarios, not axis labels.
- Client-Side Only: No data leaves the browser. No telemetry, no server-side logging, no account required.
THE ANALYZER SURFACES THE GAP.
A REVIEW CLOSES IT.
A multiplier tells you the gap exists. Closing it requires mapping dependencies, sequencing recovery order, and assigning recovery authority — work that goes beyond what any tool can score.
|
>_ Architectural Guidance
Infrastructure Architecture ReviewA structured review against your Confidence Gap findings — identifying the specific architectural work required to close it.
|
>_ The Dispatch
Architecture Playbooks. Field-Tested Blueprints.Weekly breakdowns of recovery architecture, backup blast radius, and the failure patterns that show up after the backups already ran.
Zero spam. Unsubscribe anytime. |
Frequently Asked Questions
Q: What does the Recovery Readiness Analyzer actually measure?
A: It compares two things: what your organization reports about its recovery posture — backup coverage, test history, documented targets — against what it can demonstrate: dependency mapping, recovery sequencing, isolation, governance, and actual measured recovery times. The relationship between those two numbers, expressed as the Confidence Multiplier, is the output that matters.
Q: How is this different from a backup maturity assessment?
A: Backup maturity assessments score how well backups run. This tool treats that as only half the picture. An organization can have excellent backup coverage and success rates and still be unable to execute a real recovery — because nobody has validated the order systems must come back, whether recovery can happen with production compromised, or who’s actually in charge when it counts.
Q: What environments does this cover?
A: The model is environment-agnostic. On-premises, cloud, hybrid, and virtualized infrastructure all map onto the same Reported Confidence / Validated Readiness structure. The inputs ask about capability and evidence, not platform-specific configuration.
Q: Is any data sent to a server or stored?
A: No. All scoring happens locally in your browser. Nothing you enter is transmitted, logged, or stored anywhere. This aligns with the recovery validation principles in NIST SP 800-34 (Contingency Planning Guide for Federal Information Systems) — testing and assessment should not introduce new dependencies or exposure.
🔒 Privacy Architecture: No cookies. No tracking pixels. No server-side database.
This logic runs entirely in your local browser session.