

Automation Debt Calculator
Where Does Your Automation Sit On The Debt Curve?
Stop Measuring Maturity. Start Measuring The Curve.
Most automation assessments answer “how mature is your automation.” That framing misses the actual failure mode The Automation Debt Curve describes: automation creates a second, invisible operating environment — the pipelines, modules, policies, and ownership structures required to keep the automation itself trustworthy — and organizations only discover its cost once that environment becomes more expensive to run than the infrastructure it improved. Maturity tells you how much you’ve automated. It doesn’t tell you what that automation is now costing you to sustain.
The Automation Debt Calculator doesn’t introduce a new scoring model to answer that. It operationalizes the framework that already exists. The same three dimensions the source article measures — Automation Volume, Automation Complexity, Automation Burden — are the only names this tool ever surfaces, and the same three phases — Savings Phase, Equilibrium Point, Debt Phase — are the only classification it ever returns. The output isn’t a tier. It’s a position: how far your automation environment has moved past the point where its cost overtook its value, same distinction Infrastructure Automation Ladder draws between where you are in maturity and what staying there costs.
Built for architects running the Modern Infrastructure & IaC Learning Path — this calculator is the measurement layer between “we think our automation is getting expensive to maintain” and an actual number, positioned on an actual curve, with an actual primary driver behind it.
01 — HIDDEN ASSESSMENT
Thirteen questions across six groups — Automation Sprawl, Dependency Complexity, Change Friction, Ownership Clarity, Knowledge Concentration, Operational Reliability. You never see these as a competing framework; they exist only to feed the three dimensions below.
02 — VISIBLE DIMENSIONS
Automation Volume, Automation Complexity, Automation Burden — the exact three dimensions locked in the Automation Debt Curve’s registry entry. No new vocabulary between reading the article and running the tool.
03 — SCORE ENGINE
A dimension average, adjusted by a capped imbalance factor — so a concentrated debt profile (all Complexity, little Volume or Burden) doesn’t score identically to a balanced one just because the average lands the same.
04 — CURVE POSITION
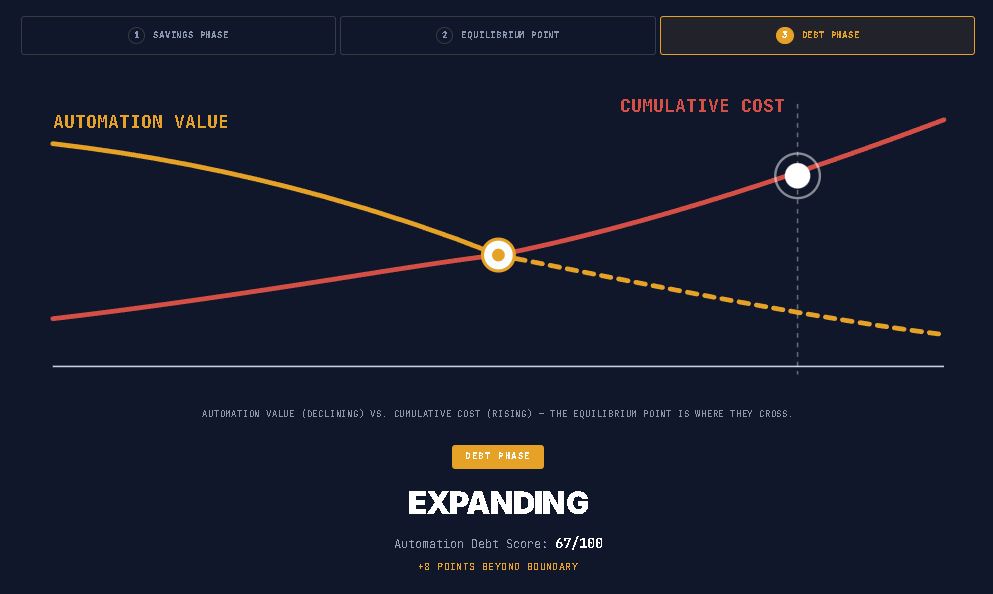
Your score maps to Savings Phase, Equilibrium Point, or Debt Phase — the same crossing-lines curve from the source article, with a conceptual position marker, not a plotted data point.
Phase Classification
The headline result is always one of the three registry-locked phases. Inside Debt Phase only, a conditional severity qualifier — the Debt Phase Indicator — adds granularity without ever competing with the phase itself as a second taxonomy.
| Phase | Meaning |
|---|---|
| Savings Phase | Automation is still producing net operational leverage |
| Equilibrium Point | Automation value and accumulated debt are approaching balance |
| Debt Phase | Operational burden is exceeding automation benefit — sub-classified as Expanding, Accelerating, Critical, or Unsustainable |
Key Features
The Score Locates The Problem.
A Review Fixes The System That Created It.
The calculator surfaces where automation debt is concentrated. An Infrastructure Architecture Review scopes the actual governance and ownership changes needed to bring it back toward equilibrium.
Infrastructure Architecture Review
Vendor-agnostic assessment of automation ownership, dependency concentration, and the governance changes required to move an environment back toward the Equilibrium Point.
- > Automation ownership & ownership-transfer design
- > Dependency concentration reduction
- > Change-friction root cause analysis
- > Automation governance model review
Architecture Playbooks. Field-Tested Blueprints.
Field-tested patterns on automation economics, IaC governance, and the difference between automation that scales and automation that becomes its own operating environment. No vendor marketing. Just architecture depth.
- > Automation Debt & Governance Patterns
- > IaC Drift & State Architecture
- > Real Failure-Mode Case Studies
- > Platform Engineering Economics
Zero spam. Unsubscribe anytime.
Frequently Asked Questions
Q: What does the Automation Debt Calculator actually measure?
A: Where your automation environment sits on the Automation Debt Curve (Framework #139) — scored across Automation Volume, Automation Complexity, and Automation Burden, then classified into Savings Phase, Equilibrium Point, or Debt Phase. Inside Debt Phase, a conditional severity indicator (Expanding/Accelerating/Critical/Unsustainable) adds detail.
Q: How is this different from a general automation maturity assessment?
A: Maturity assessments answer how much you’ve automated and how sophisticated the tooling is. This tool answers a narrower, more specific question: has your automation’s operating cost overtaken the value it was built to create, and by how much. It’s a companion measurement tool for one specific framework, not a general maturity benchmark.
Q: Why are there hidden question groups if the results only show three dimensions?
A: The three dimensions — Volume, Complexity, Burden — are the framework’s own locked vocabulary. The six question groups underneath (Sprawl, Dependency Complexity, Change Friction, Ownership Clarity, Knowledge Concentration, Operational Reliability) exist to make those three dimensions measurable with enough granularity, without introducing a second, competing vocabulary for readers to learn.
Q: What is the Equilibrium Distance metric?
A: A supporting interpretation of how far your score sits from the Debt Phase boundary — framed relative to your current phase (points remaining before Debt Phase, or points beyond it), not exposed as its own standalone score.
Q: Is any data sent to a server or stored?
A: No. All thirteen answers, the scoring, and the curve visualization are computed entirely in your browser’s client-side memory. Nothing is transmitted to Rack2Cloud servers or any third-party API.
🔒 Privacy Architecture: No cookies. No tracking pixels. No server-side database.
This logic runs entirely in your local browser session.