

The Automation Debt Curve: Why Automation Eventually Costs More Than It Saves
The automation debt curve describes what most organizations get backwards about infrastructure automation: it doesn’t become expensive because you automate more. It becomes expensive because yesterday’s automation has to survive today’s environment — new Kubernetes versions, new compliance requirements, new team structures, new dependency chains — while the organization keeps measuring success by how much got automated, not by how much it now costs to keep that automation trustworthy.
Automation Didn’t Remove Complexity. It Relocated It.
Every automation initiative starts with the same pitch: eliminate manual toil, remove human error, reclaim engineering time. And for a while, that’s exactly what happens. A team that used to hand-configure network policies now applies them through a pipeline. A provisioning process that took four people three days now takes one engineer twenty minutes. The complexity that used to live in tribal knowledge, tickets, and Slack threads gets compiled into code.
That’s not an illusion — it’s real, measurable savings. This isn’t an argument against automation. It’s an argument against treating the manual-execution complexity you removed as complexity you eliminated, rather than complexity you relocated.
The complexity didn’t disappear. It moved into the automation itself: into the pipelines that apply the configuration, the modules that encode the policy, the tests that verify the automation still does what it claims, the dependency chains between tools, and the ownership structure that determines who’s accountable when any of it breaks. None of that existed when the work was manual. All of it exists now, and all of it requires the same operational discipline — monitoring, patching, incident response, documented ownership — that infrastructure itself requires.
Most organizations don’t budget for that discipline, because the automation doesn’t look like infrastructure. It looks like tooling. And tooling, unlike infrastructure, rarely gets its own operational review.
The Second Operating Environment
Before naming the framework, it’s worth being precise about what it isn’t. Infrastructure Automation Ladder (Framework #138) asks a maturity question: how far has an organization progressed from manual, hands-on-keyboard changes toward governed, policy-driven automation? It’s a position on a six-level curve — Manual Infrastructure through Autonomous Infrastructure Governance.
Automation Debt Curve (Framework #139) asks a different question entirely: once an organization has climbed that ladder, what does it cost to keep standing at that level? Framework #138 measures how far up the ladder you’ve climbed. Framework #139 explains why staying there gets more expensive over time, independent of whether you climb any further.
That distinction matters because the two get conflated constantly. An organization at Level 4 on the Ladder — full platform automation — can still be deep in automation debt, because Level 4 doesn’t describe an operating cost, it describes a capability. The Automation Debt Curve is what happens after the capability exists: the pipelines, modules, policies, tests, dependencies, and ownership structures required to keep that capability trustworthy become a second operating environment, running parallel to the infrastructure it manages — and that environment has its own lifecycle, its own failure modes, and its own cost curve, largely invisible to whoever is tracking automation coverage as the only success metric.
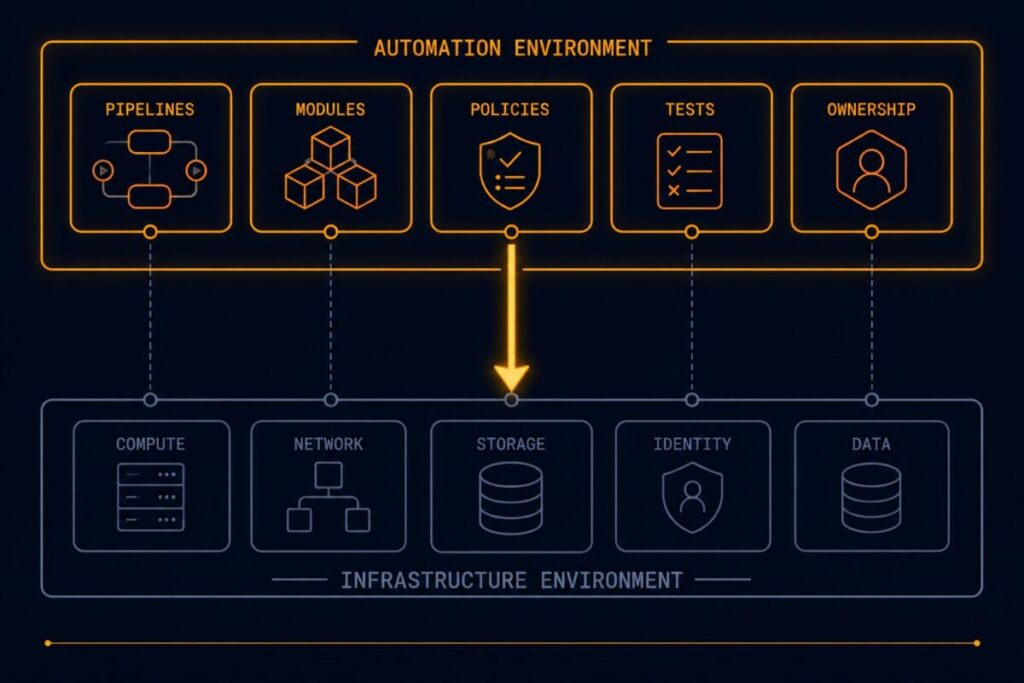
The automation platform becomes infrastructure that requires infrastructure discipline. Most organizations discover this only after the discipline has already been absent for years.
Compatibility Is Not The Same Thing As Support names the same gap on the accountability side rather than the cost side: a pipeline can keep executing exactly as before while the organization behind a dependency inside it — an OS architecture, a runtime, a toolchain — quietly stops being responsible for keeping that dependency working. Automation debt is what that gap costs once it’s discovered. The lifecycle support boundary is where the gap actually starts.
The Automation Debt Curve
FRAMEWORK #139 — AUTOMATION DEBT CURVE
Infrastructure automation creates a second, invisible operating environment — and organizations only discover its cost once that environment becomes more expensive to operate than the infrastructure it was built to improve.
The curve doesn’t fail when automation gets expensive to run — it fails when organizations keep expanding it without ever measuring the operating system required to sustain it.
Architectural Relationships
Infrastructure Automation Ladder
Why It Connects
Extends the maturity position Infrastructure Automation Ladder measures — Ladder is where you are, Debt Curve is what staying there costs.
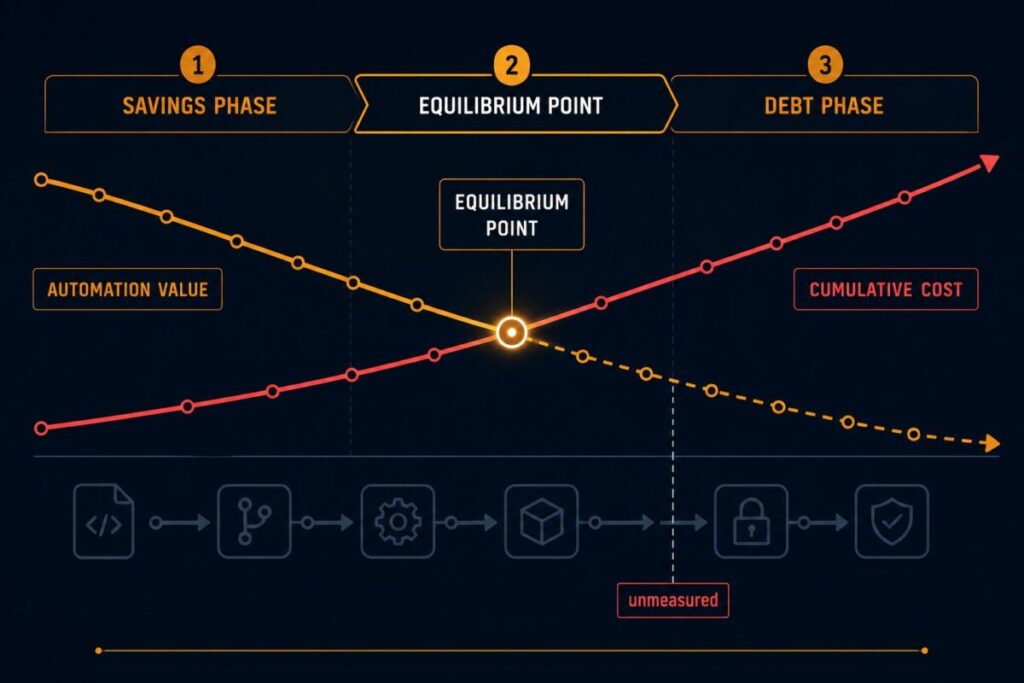
Explore Framework →Every automation program moves through three states, whether or not anyone’s tracking which one it’s in.
In the Savings Phase, the dominant cost center is Build — writing the pipeline, encoding the policy, standing up the module. This is the phase every automation pitch is built around, and correctly so: build costs are one-time, savings are recurring, and the math genuinely favors automating.
At the Equilibrium Point, the dominant cost shifts to Stabilize — keeping the automation itself correct as the environment around it moves. New provider versions, new compliance requirements, drifted state, deprecated modules. This is where most organizations still believe they’re in the Savings Phase, because the automation is still running and still producing output. It’s producing output at a rising operating cost that isn’t being measured against the value it delivers.
In the Debt Phase, the dominant cost is Sustain — and this is the phase that gets missed entirely, because it isn’t about the automation anymore. It’s about the environment the automation depends on: the identity system it authenticates against, the CI/CD platform it runs inside, the secrets management it trusts, the team structure that owns each piece. Sustaining that environment is a standing operational commitment, not a one-time build cost, and it compounds the longer it goes unmeasured. This is the insight the framework exists to name — not that automation gets complex, but that the environment automation depends on becomes something the organization has to actively keep alive, indefinitely, whether or not anyone assigned that job to a team.
Measuring the Curve
The Automation Debt Curve is measured across three dimensions. None of them evaluate whether the automation was built well — they evaluate what it costs to operate, which is a different question with a different answer.
Automation Volume — not a count of automated processes, but the size of the operating surface that now requires ongoing attention: how much of the automation layer needs to keep functioning correctly, continuously, for infrastructure to behave as declared.
Automation Complexity — not a measure of clever engineering, but of coordination cost: how many teams, systems, and approval paths have to stay synchronized for a single automated change to land safely.
Automation Burden — the recurring effort required to keep the automation trustworthy: patching the pipeline tooling, revalidating policy against new requirements, re-certifying that the automation still does what its documentation claims.
An organization can score well on maturity — high on the Infrastructure Automation Ladder — while scoring poorly on all three of these, because maturity measures capability, and these three measure the standing cost of keeping that capability alive. This is precisely the gap most Modern Infrastructure & IaC governance programs leave open: automation coverage gets tracked, automation operating cost doesn’t.
Why Existing Debt Models Miss This
Technical debt has a well-understood definition: shortcuts taken in implementation that cost more to unwind later than they saved at the time. It’s a useful model, and it’s the wrong one for this problem.
| Technical Debt | Automation Debt | |
|---|---|---|
| What accumulates | Shortcuts in how something was built | Operational obligations required to keep something trustworthy |
| Root cause | Corners cut under time pressure | Environment changing faster than the automation’s operating discipline scales |
| Where it’s visible | In the code itself | Outside the automation — in the systems it depends on |
| How it’s paid down | Refactoring the implementation | Investing in the operating environment, not the automation logic |
| Can exist without shortcuts? | No — by definition, it requires a corner cut | Yes — automation debt accumulates even in well-built automation, simply from environmental drift over time |
That last row is the one worth sitting with. Automation debt isn’t a quality problem. An organization can write disciplined, well-tested, well-documented automation and still accumulate debt against this framework — because the debt isn’t in what was written, it’s in what has to keep being true around it for the automation to keep working. It’s the same underlying argument as designing for detection, not prevention in IaC drift management: the goal isn’t a state of permanent correctness, it’s a measurement discipline that catches divergence before it compounds.
Worked Example: The Terraform Day 2 Operations Debt Pattern
Read the full pattern: The Day 2 Operations Debt You Inherited From Terraform
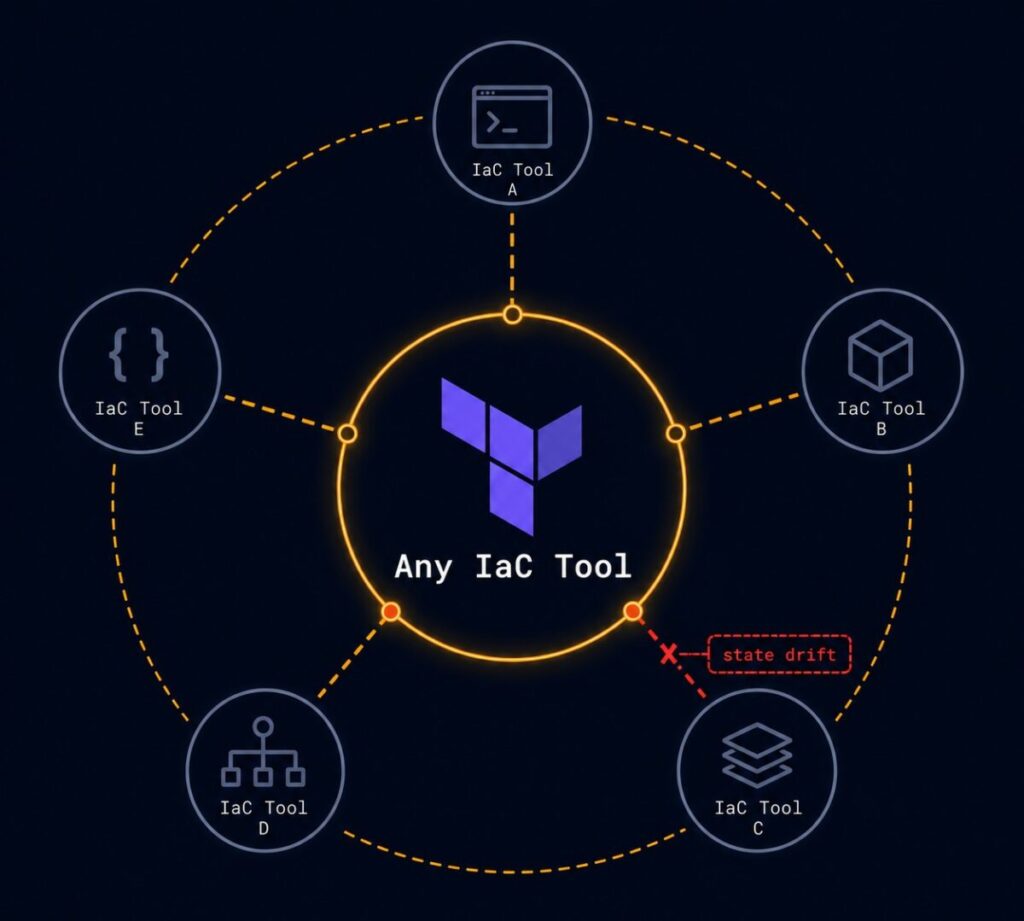
Terraform is a useful lens here, not because the framework is about Terraform — it isn’t — but because the Terraform Day 2 Operations Debt pattern is a clean, already-documented instance of the Automation Debt Curve in motion. Swap in Ansible, Pulumi, a GitOps controller, CloudFormation, or Azure Automation and the shape of the problem holds: initial adoption produces fast, visible wins (Savings Phase), and the organization keeps measuring success against those wins long after the dominant cost has shifted to state management, module sprawl, and provider version drift (Debt Phase) — with no Equilibrium Point ever explicitly acknowledged in between.
Terraform is not the problem. The operating model surrounding Terraform determines whether automation remains an asset or becomes debt — and that’s true regardless of which tool sits at the center of the pipeline.
Assessing Where You Sit on the Curve
Automation debt rarely announces itself as a cost problem first — it usually surfaces as a governance and drift problem, because that’s the layer where the second operating environment’s failures become visible before their operating cost does. Two assessments map to this framework, both positioned as architectural-condition assessments — the same posture as the Recovery Readiness Assessment’s Confidence Multiplier — not financial accounting.
IaC Operating Cost Modeler — a lifecycle assessment of where a given automation estate sits on the curve at the portfolio level, rather than a single system, scored against the same three dimensions. Still in development; no live tool to link yet.
Both stay in operational-burden language deliberately. The moment either becomes a savings calculator or an ROI estimator, it stops measuring what the framework is actually about.
Architect’s Verdict
Automation doesn’t fail because organizations stop writing it. It becomes difficult because organizations never stop carrying it — and nobody assigned the job of noticing when the weight changed.
The real failure isn’t technical. It’s a measurement gap: automation programs get evaluated on what they automated, almost never on what it now costs to keep that automation trustworthy as the environment around it keeps moving. The Infrastructure Automation Ladder tells you how far you’ve climbed. The Automation Debt Curve tells you what it costs to keep standing there — and that cost doesn’t announce itself. It accumulates quietly in the second operating environment until the day someone finally asks why the automation platform needs its own platform team.
Automation rarely fails because organizations stop writing it. It becomes difficult because organizations never stop carrying it.
Additional Resources
Editorial Integrity & Security Protocol
This technical deep-dive adheres to the Rack2Cloud Deterministic Integrity Standard. All benchmarks and security audits are derived from zero-trust validation protocols within our isolated lab environments. No vendor influence.

R.M.
Senior Solutions Architect with 25+ years of experience in HCI, cloud strategy, and data resilience. As the lead behind Rack2Cloud, I focus on lab-verified guidance for complex enterprise transitions. View Credentials →
Get the Playbooks Vendors Won’t Publish
Field-tested blueprints for migration, HCI, sovereign infrastructure, and AI architecture. Real failure-mode analysis. No marketing filler. Delivered weekly.
Select your infrastructure paths. Receive field-tested blueprints direct to your inbox.
- > Virtualization & Migration Physics
- > Cloud Strategy & Egress Math
- > Data Protection & RTO Reality
- > AI Infrastructure & GPU Fabric
Zero spam. Includes The Dispatch weekly drop.
Architecture Audit Services
Fixed-scope audits for Zero-Trust Azure, VMware migration readiness, and recovery posture — no discovery call required to start.
>_ View Audit Services>_Related Posts
ZFS vs Ceph vs NVMe-oF: Choosing the Right Storage Backend for Modern Virtualization
I still have nightmares about a storage migration I ran back in 2014. >_ Architect’s Brief 60-second read before you commit to the full post · Full post: 7 min Generating brief… We were moving off a monolithic SAN and onto an early “software-defined” storage platform. The sales engineers promised infinite scalability and self-healing magic….
Your Kubernetes Cluster Isn’t Out of CPU — The Scheduler Is Stuck
Compute Tier 1 Authority Cascades to ➔ >_ Architect’s Brief 60-second read before you commit to the full post · Full post: 9 min Generating brief… [Storage] [Network] 🚨 Failure Signature Detected Grafana shows cluster CPU utilization is under 50%, but pods are stuck in Pending. Events show: 0/10 nodes are available: 10 Insufficient cpu….
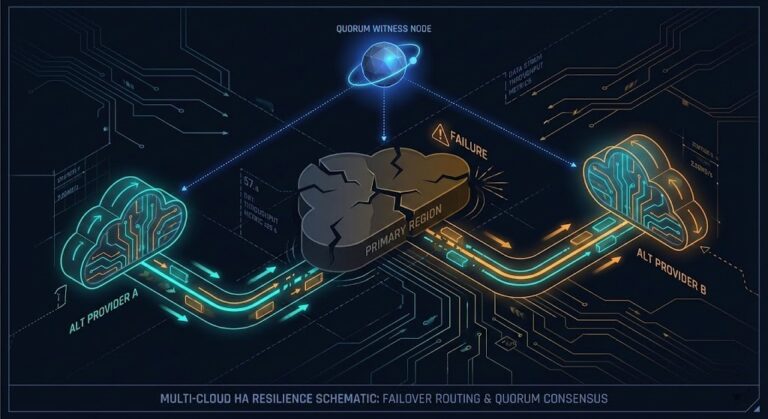
Your Cloud Provider Is Not Your HA Strategy
A Tactical Playbook for Architecting, Testing, and Automating Real Multi-Cloud & Multi-Region Resilience We’ve previously explored why cloud SLAs fail as guarantees in our deep dive, Cloud SLA Failure & Resilience Strategy. This article focuses on how to survive those failures in practice — architecturally, operationally, and financially. >_ Architect’s Brief 60-second read before you…
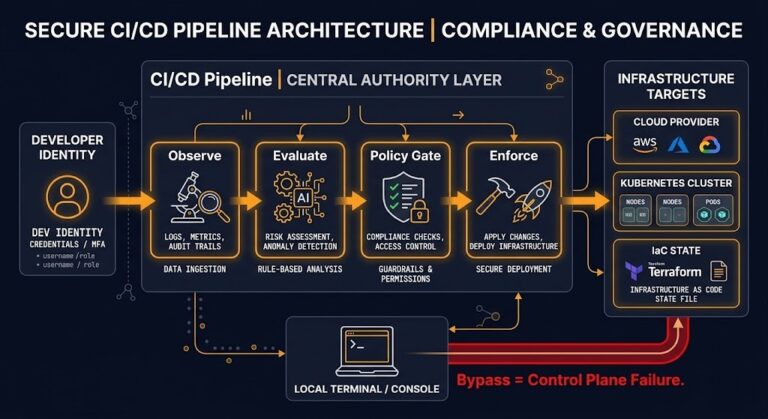
Your CI-CD Pipeline Is Your Real Infrastructure Control Plane
Terraform defines desired state. Kubernetes reconciles workload state. Cloud consoles expose state. None of those systems decides whether infrastructure state is allowed to change. The ci-cd control plane does — or more precisely, the CI-CD pipeline is the only system in most environments that can hold that authority. That distinction — between storing state and…
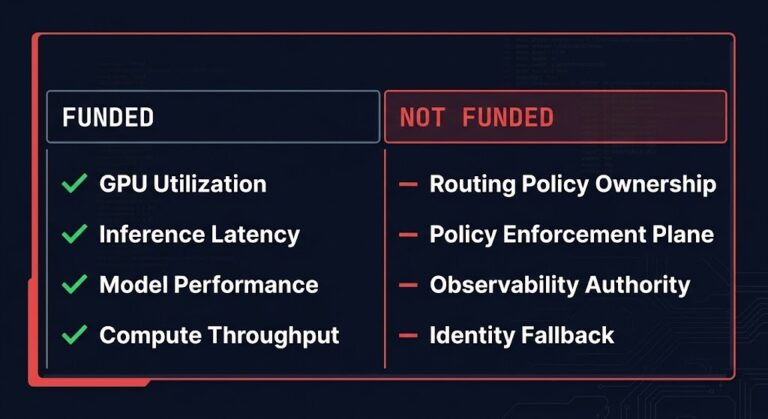
Your AI Infrastructure Is Probably Solving the Wrong Problem
Most AI infrastructure programs are producing exactly the results they were funded to produce: higher GPU utilization, lower inference latency, and better model performance. The problem is that none of those metrics measure whether the organization actually controls its AI infrastructure. >_ Architect’s Brief 60-second read before you commit to the full post · Full…
Why Infrastructure Survivability Fails After The Design Review
Infrastructure survivability is not something an architecture has. It’s something an organization keeps proving, on a schedule nobody wrote down, long after the design review that approved it has been forgotten. >_ Architect’s Brief 60-second read before you commit to the full post · Full post: 8 min Generating brief… That review happened. Redundancy was…