

VMWARE LICENSING COST MODEL
PROJECT YOUR VVF OR VCF RENEWAL ACROSS THREE YEARS, THREE CONTRACT SCENARIOS, AND THREE TERM STRUCTURES — WITH COMPRESSION LEVERS AND ARCHITECTURE CONDITIONS BUILT IN.

🔒 Privacy Architecture: No cookies. No tracking pixels. No server-side database.
This logic runs entirely in your local browser session.
The VMware Licensing Cost Model is Step 2 in a two-tool sequence. Where the VMware Core Calculator audits your licensed core footprint, this tool takes that number and projects what it costs — across three years, three contract scenarios, and three term structures — and flags the conditions that tell you whether the cost reflects the environment or is working against it. Renewal economics are a virtualization architecture decision, not a procurement line item.
Year-one VMware licensing cost is not the number that matters for infrastructure planning. It is why most VMware licensing estimates are wrong: the subscription renews, and it renews at Broadcom’s pricing at the time of renewal. The enterprises now in VMware licensing disputes were not surprised by year-one invoices. They were surprised by year two and year three. For most estates, the renewal decision was made two years ago — this model makes those numbers visible before the renewal conversation starts, not after it ends.
Most VMware cost estimates stop at a single number derived from a single assumption. This model runs Low, Typical, and Aggressive contract scenarios against the same footprint and surfaces the spread between them. That spread is the negotiation range. It does the same for term structure: a one-year rolling term reprices at every renewal, while a three- or five-year protected term holds the rate but converts future spend into a commitment you cannot exit. Both sides of that trade-off are modeled, not assumed.
The cost outputs are not the primary deliverable. The conditions are. Cost visibility is not cost control — a projection matters only if it changes a decision. When escalation or term commitment starts constraining your ability to move, the model flags the Economic Gravity Boundary. When a VCF bundle is carrying NSX and vSAN that are not in production, it flags the premium as unvalidated. Compression levers are ranked by three-year impact, so the brief you take into the renewal starts with the largest lever, not the most obvious one. If the conditions point toward exit rather than renegotiation, the VMware migration strategy stage covers what that sequence actually requires.
If you haven’t run the VMware Core Calculator yet, start there. The primary input to this tool — total licensed cores — has to account for the 16-core-per-CPU floor and BIOS-disabled cores, both covered in Precision Licensing: Calculating VVF and VCF Cores. Running the cost model against an unverified core count produces an unverified cost projection.
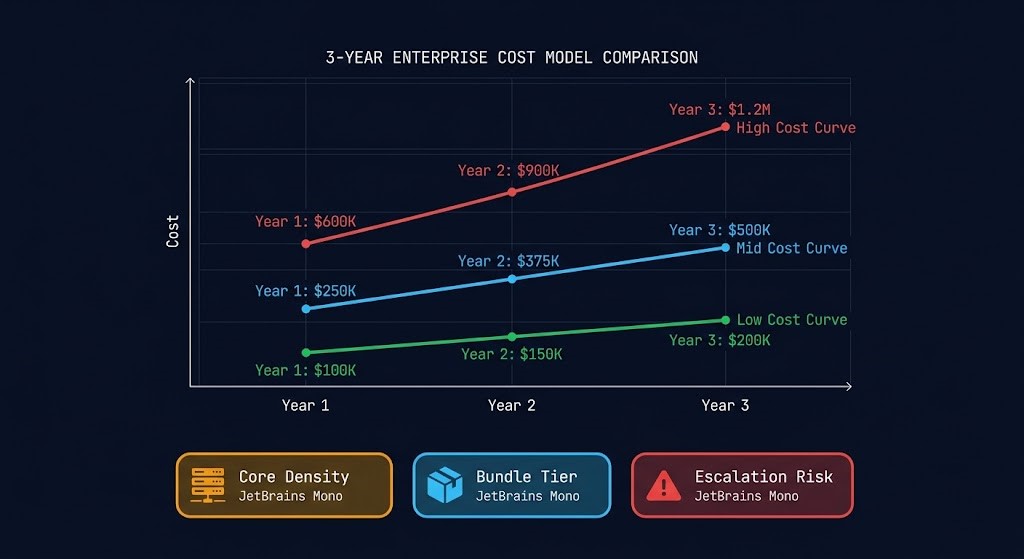
VMware Licensing Cost Model: Key Features
- Negotiation Range: Low, Typical, and Aggressive contract scenarios run against the same footprint, surfacing the Year 1 and three-year spread between a favorable outcome and a near-list renewal — a range to budget against, not a single point estimate.
- Term Structure Modeling: One-year rolling, three-year protected, and five-year protected terms are modeled side by side on the same inputs — escalation avoided versus non-cancellable commitment — so “negotiate a multi-year lock” becomes a number, not advice.
- Cost Compression Levers: VVF downshift, protected term, host retirement, standby reservation, and DR footprint reduction are ranked by three-year impact. Consolidation math runs in whole hosts at your actual density, not in abstract 16-core blocks. Methodology informed by FinOps Foundation cost modeling principles.
- Architecture Conditions: Escalation-driven lock-in maps to the registered Economic Gravity Boundary framework (#131). A VCF bundle without NSX and vSAN in production is flagged as an unvalidated premium — the question behind decoupling the VCF stack. When nothing triggers, the model says so.
- VVF vs VCF Decision Matrix: Both bundle tiers priced against your footprint, with Year 1, three-year, cost-per-VM, and per-core ratio side by side, read against your stated NSX and vSAN utilization — the same positioning question covered in VCF vs vSphere + NSX.
- Pressure Index and Data Confidence: A five-component pressure score and a six-input confidence check, both calculated only from values you enter. Defaults never count as evidence. All pricing uses observed post-Broadcom ranges — VVF $90–$150 and VCF $190–$350 per core per year — not Broadcom list pricing; verify current pricing before any renewal commitment.
THE MODEL SURFACES THE EXPOSURE.
THE ASSESSMENT SURFACES THE BLOCKERS.
Your three-year projection tells you what renewal will cost. Whether you renegotiate, restructure, or exit depends on what your environment is actually ready to do — and that requires a second audit. The Migration Readiness Assessment runs locally in your vSphere environment and returns a scored readiness report across five domains within two business days.
|
>_ Architectural Guidance
VMware Migration Readiness AssessmentDetermine whether your VMware environment is operationally ready for migration before investing in tooling, discovery, or cutover planning.
Delivered within 2 business days. No credentials required. No vCenter access granted. >_ Run the Readiness Assessment |
>_ The Dispatch
Architecture Playbooks. Field-Tested Blueprints.Broadcom renewal decision frameworks, VMware exit architecture, and post-migration Day 2 operations — built from production environments, not vendor documentation.
Zero spam. Unsubscribe anytime. |
Frequently Asked Questions
Q: What pricing data does the VMware Licensing Cost Model use?
A: All projections use observed post-Broadcom enterprise pricing ranges from 2026 market data — VVF at $90–$150 per core per year and VCF at $190–$350 per core per year, spanning favorable negotiated outcomes through near-list renewals. These are realized contract ranges, not Broadcom list prices; Broadcom does not publish a standard enterprise rate card. Actual cost varies with term, volume, region, and negotiation leverage. Verify current pricing with Broadcom or your reseller before finalising a renewal budget.
Q: What is the difference between the VMware Core Calculator and the VMware Licensing Cost Model?
A: The VMware Core Calculator (Step 1) audits your licensed core footprint — applying the 16-core-per-CPU floor, calculating vSAN entitlement, and surfacing ghost core exposure. The VMware Licensing Cost Model (Step 2) takes that footprint and projects what it costs across three contract scenarios, three term structures, and both bundle tiers, then flags the architecture conditions behind the number. Run Step 1 first to get a verified core count.
Q: What does “Contract Variability Factor” mean?
A: Broadcom does not publish standard list pricing for enterprise VMware subscriptions. Contract pricing varies with volume, term length, negotiation leverage, and whether transition accommodations apply. The Contract Variability Factor represents three positions within the observed market range: Low reflects a favorable negotiated outcome, Typical reflects the market midpoint, and Aggressive reflects a near-list renewal with minimal concession. The spread between them is the negotiation range your renewal budget should plan against.
Q: How does contract term change the projection?
A: On a one-year rolling term, every renewal reprices, so escalation compounds into Year 2 and Year 3. A three- or five-year protected term holds the per-core rate flat but converts future spend into a commitment that typically cannot be terminated early. The model shows both sides — escalation avoided and non-cancellable commitment — because price protection versus optionality is an architecture decision, not a procurement detail.
Q: How is the Licensing Pressure Index calculated?
A: Five components, each scored from 0 to 1: escalation exposure, unvalidated bundle premium, workload density, DR and standby share, and commitment rigidity. The sum sits on a five-point scale — below 1.5 is low, 1.5 to 3.0 is moderate, above 3.0 is high. The index is only calculated once you have entered your own core and host counts; default values never produce a score.