

Memory Tiering Lets You Buy Less DRAM. It Also Adds a Failure Domain.
Memory tiering turns a DRAM purchase into two decisions: how much memory you can stop buying, and how much of the host’s memory you are willing to put behind a dedicated NVMe tier, whether a single device or a mirrored pair. The second decision is the one that gets skipped, because the DRAM saving shows up in the quote and the failure domain does not. Broadcom’s vSphere 9.1 documentation also draws a line that changes how the feature should be evaluated: its Best Practices page tells operators not to use memory overcommit while tiering is activated.
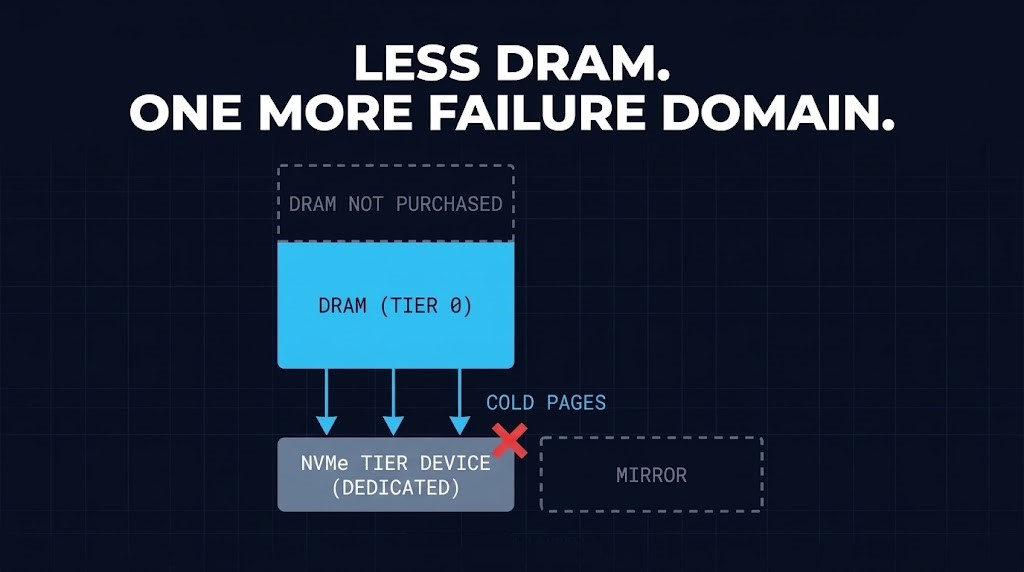
That makes memory tiering a different decision from memory overcommit, which is about how far provisioned memory can exceed physical memory, with ballooning, compression and host swap as distinct reclamation mechanisms. Tiering replaces that bet with a purchase: a dedicated device that holds the cold, eligible part of each VM’s memory. This post works through when that purchase can justify buying less DRAM, taking the constraints from Broadcom’s documentation and the economics from a sensitivity model with its assumptions exposed. It does not claim a saving for a typical environment, because nothing in the evidence says what a typical environment looks like.
What Memory Tiering Provisions, and What It Does Not
Memory tiering adds a second tier of memory to an ESX host, with DRAM as Tier 0 and a local NVMe device as Tier 1. Three properties of the design drive everything that follows. Only VM memory pages are tiered, and Broadcom states that kernel memory never is. The device is dedicated: it cannot be shared with other services such as vSAN or boot. And the amount of NVMe the host uses is the smaller of two figures, the size derived from the DRAM:NVMe ratio and the size of the device partition.
For a virtualization architecture decision, the useful unit is the host purchase: the DRAM, a device dedicated to the tier, and a second device if the tier is mirrored. Broadcom’s documentation sets the default ratio at 1:1, capped at 4 TB, and its own sizing example allocates a 1 TB tier from a 1.6 TB drive to reach 2 TB of host capacity. The configuration accepts ratios from 1 to 400 percent of DRAM, which allows a larger NVMe tier, and Broadcom’s knowledge base says Tier 1 can be raised to four times DRAM; Epping’s ESXCLI post shows the same 1 to 400 range. Broadcom recommends keeping the 1:1 default and confirming that active memory fits in DRAM before changing it. This post deliberately uses 1:1 as its design boundary, not as a platform limit, and everything below stays at 1:1 or under.
Because the whole device is dedicated, a smaller ratio does not shrink the purchase. A 1 TB tier carved from a 1.6 TB drive costs a 1.6 TB drive, and mirroring it costs two. The device has to be a local, mixed-use NVMe drive that meets Broadcom’s criteria: endurance class D at 7,300 TBW or more, performance class F or G, and 3 or more drive writes per day. Hot-plug and prepare-to-remove are not supported for a device the tier is using.
Broadcom describes three differences between memory tiering and swap. Tiering classifies hot and cold pages with page-aging techniques where swap picks pages at random. It runs on a dedicated, direct-attached device where swap often shares a device with guest storage. And it reaches correct, fast behavior through planning, namely the ratio and keeping active memory inside DRAM. The short version for a design review is that swap is what a host does after it runs out of DRAM, and tiering is a decision made before it does. The earlier argument that NVMe does not rescue a host from hypervisor swap still stands: tiering is not swap onto faster disk.
Eligible Memory Is Smaller Than Consumed Memory
Broadcom lists nine VM types that stay in DRAM: 1 GB page, confidential, fault tolerant, large, low latency, nested virtualization, PCI passthrough, prealloc and vQAT VMs. The 9.1 documentation says they can run on a host with tiering active but are excluded from the process, so their memory is DRAM the host needs whatever the ratio. Virtualization-based security VMs are the one documented exception among nested VMs: tiering is off for them by default, and the vmx option sched.mem.enableNestedTiering turns it on, with the instruction to understand and test the workload first.
The large-VM threshold needs care. The documentation says VMs with more than 512 GB of memory and 64 vCPUs may see degraded performance, and recommends disabling tiering for them and giving them full memory reservations. It does not say whether a VM must exceed both figures or either, and this post does not resolve that. A VM near either figure belongs in the test plan, not the eligible pool.
Turning memory tiering off for a VM has its own cost. Broadcom says the VM then needs a full memory reservation, because without one it can end up with pages in the host swap file, which performs worse than tiered memory. The working number for design is the eligible share: eligible memory as a fraction of consumed memory, after the exclusions and after any VMs you deactivate.
DIAGNOSTIC QUESTION
“After the exclusions, how much of this host’s consumed memory is actually allowed on the device?”
Active Memory Sets the Floor, Not Consumed Memory
Broadcom frames memory tiering suitability around two numbers. It fits hosts where allocated memory is high, above 50 percent across the VMs, and active memory stays below 50 percent of DRAM. It says most workloads run at 10 to 30 percent active, and that active memory should not exceed 50 percent of DRAM to minimize the performance impact. The figure is guidance. Nothing in the pages reviewed describes it as enforced admission control, so no mechanism stops a host from exceeding it.
The design requirement is therefore measured peak active memory, not an average and not the 50 percent figure treated as a promise. Measuring that peak, along with reclamation behavior and failure-state headroom, is performance modeling work, and it has to be done on the hosts you intend to cut, not on a fleet average.
Engagement adds a second trap. Broadcom says cold pages begin moving to NVMe when host memory consumption reaches about 80 percent of DRAM, and that the tier classifies pages by recency and frequency, scanning each VM’s memory in batches. A lightly loaded test host can therefore show an idle tier and prove nothing about the workload it will carry later.
Broadcom’s monitoring guidance for memory tiering is also easy to over-read. It says to start watching device latency once NVMe read bandwidth exceeds 200 MB/s, and reports that its test device held read latencies under 200 microseconds at roughly 400 MB/s while other devices showed closer to 300 microseconds at similar bandwidth. Those are monitoring context and observed device results. They are not limits, guarantees or alert thresholds.
The Tier Device Is a Failure Domain
The Failure Scenarios page describes the unmirrored memory tiering case plainly. When the device fails, VMs with pages on it keep running as long as those pages are not accessed. If a page fault hits a page on the failed device and cannot be serviced, the VM powers off. VMs that use only DRAM are unaffected. vSphere HA restart policies can bring the powered-off VMs back on another host, provided the cluster has the capacity, and Broadcom notes that no dedicated failover host is required.
That restart is where the capacity question returns, because the capacity problem appears after the failure, not during deployment. A cluster whose DRAM was cut on every host has less headroom to absorb restarted VMs, and the model below does not cover that state.
The same page says that placing a host in maintenance mode after a device failure is a manual operation in vSphere 9.1, either by an operator or through a hardware management plug-in such as Dell OpenManage or HPE OneView. vSphere does not enter maintenance mode on its own. Mirroring changes the picture, and its documentation lives on the Configuration page: software mirroring, new in 9.1, keeps the data available on the second device so the VM continues, with two devices of the same size or larger replicated at the same partition and block. The Failure Scenarios page does not describe mirrored behavior. A mirrored pair is intended to preserve tier availability through a single-device failure; the documentation reviewed does not establish the behavior after a second device failure or while the mirror is degraded. Duncan Epping, a Broadcom engineer writing on his own blog and so a secondary source rather than product documentation, wrote in Memory Tiering Considerations and frequently asked questions (July 16, 2026) that reads are distributed round robin across the pair and that an unmirrored failure is handled like a DRAM DIMM failure, with an HA restart.
Three cases are not addressed in the pages reviewed: what happens when a host boots with a tier device missing, what happens on a second failure in a mirrored pair, and how the tier behaves while a mirror is degraded. Until Broadcom documents them, they are acceptance items for the design, not assumptions.
⚠ DOCUMENTED VERSUS ASSUMED
A mirrored pair is intended to survive one device failing. Boot with a missing device, a second failure and a degraded mirror are not documented in the pages reviewed, so none of them is a modeled outcome in this post.
Recovery Is a Manual Maintenance Window
Broadcom’s documentation allows memory tiering to be deactivated, reconfigured or replaced only with the host in maintenance mode. Hot-plug is not supported, so replacing a failed or worn tier device means deactivating tiering on that host, and when a host runs a mix of tiered and non-tiered VMs, entering maintenance mode evacuates all of them by vMotion.
Evacuation on a tiered host is slower than a normal vMotion. Broadcom says vMotion takes 1.5 to 2 times longer on a tiered host because pages must be fetched from the NVMe tier first, and that the destination host begins tiering a migrated VM’s pages immediately, even if the source was not tiering that VM. Quick Boot is not supported on hosts with tiering active, and suspend to memory is not supported either, which matters for patch windows.
Changing which VMs participate in memory tiering also changes the arithmetic. Broadcom’s example is a host with 1 TB of DRAM and a 1 TB tier: give two 200 GB VMs full reservations and remove them from tiering, and the effective ratio for the remaining tiered VMs falls to roughly 0.6:1. That is Broadcom’s illustration, not this post’s model, but it shows that tier membership is a capacity decision as well as a configuration one.
The recovery path is detect, enter maintenance mode, evacuate at the slower rate, deactivate, replace, reactivate. The documentation reviewed gives no duration for any step, so the cost of that window is not in the model.
A Sensitivity Model: The Binding Constraint Moves
The memory tiering model below is a sensitivity analysis, not a forecast. Its baseline is hypothetical: a host whose VMs consume 2,048 GB in aggregate, with 2,048 GB of DRAM allocated to the modeled VM-memory requirement before host overhead is added. C is aggregate VM consumed memory only. ESXi kernel memory and per-VM overhead are never tiered, stay in DRAM before and after, and sit outside the model, so the ratio terms below are applied to VM memory alone, which is a simplification. The resulting DRAM figure is a VM-memory requirement, not the final host DIMM requirement; ESXi and per-VM overhead must be added before selecting the physical DRAM configuration. No evidence says how common that baseline is, so the numbers show what a purchase decision could look like, not what a typical fleet saves.
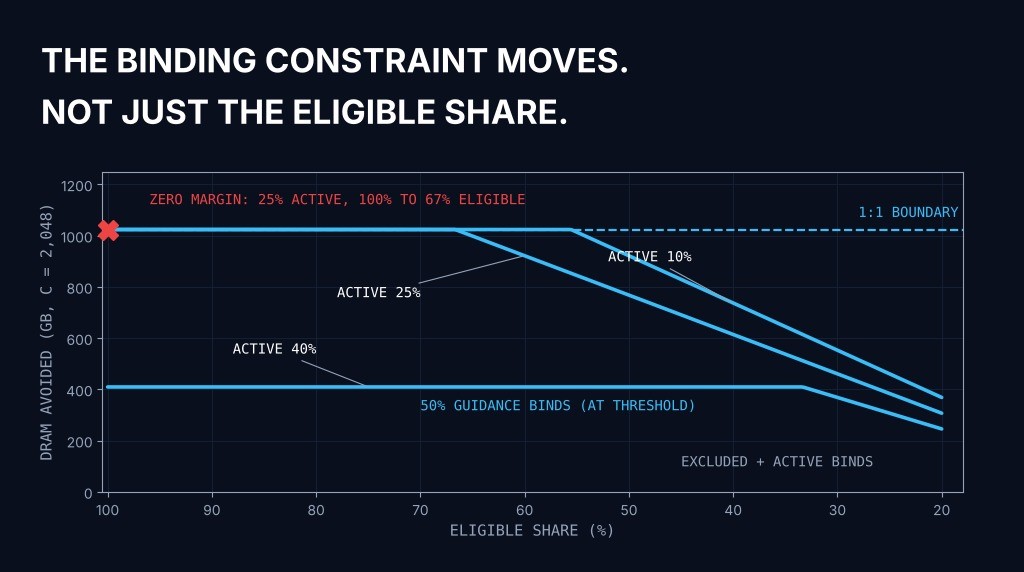
Three terms limit how far DRAM can be cut. With C as consumed memory, f as the eligible share and p as the active share, the minimum DRAM is the largest of three values: DRAM_min = max( (1 − f)·C + p·f·C, C ÷ 2, 2·p·C ). The first is the excluded memory plus the eligible active memory, because excluded memory stays resident in DRAM. The second is the 1:1 boundary, since DRAM plus an equal-sized tier has to cover C. The third is the 50 percent active-memory guidance. The tier needed is C minus DRAM_min.
Two assumptions deserve emphasis. The active share p is applied proportionally to eligible and excluded memory; that is a modeling assumption, not a Broadcom finding, and measured data replaces it. And the 10, 25 and 40 percent values are assumptions that bracket Broadcom’s statement that most workloads run at 10 to 30 percent, with 40 as a stress case.
| Active share (p) | Eligible share (f) | DRAM_min (GB) | Binding term | DRAM avoided (GB) | Active ÷ DRAM_min |
|---|---|---|---|---|---|
| 10% | 100% | 1,024 | 1:1 boundary | 1,024 | 20% |
| 10% | 60% | 1,024 | 1:1 boundary | 1,024 | 20% |
| 10% | 40% | 1,311 | excluded + active | 737 | 16% |
| 10% | 20% | 1,679 | excluded + active | 369 | 12% |
| 25% | 100% | 1,024 | 1:1 boundary (guidance ties) | 1,024 | 50% |
| 25% | 60% | 1,126 | excluded + active | 922 | 45% |
| 25% | 40% | 1,434 | excluded + active | 614 | 36% |
| 25% | 20% | 1,741 | excluded + active | 307 | 29% |
| 40% | 100% to 40% | 1,638 | 50% guidance | 410 | 50% |
| 40% | 20% | 1,802 | excluded + active | 246 | 45% |
At 25 percent active and a fully eligible host, the 1:1 boundary and the 50 percent guidance bind together, which leaves zero margin. At 40 percent active, the guidance caps the saving at 410 GB all the way down to a 40 percent eligible share. So eligible share is not the deciding variable in general. Which constraint binds depends on the active share.
These 50 percent cases are mathematical boundary examples, not qualifying deployment configurations. Gate 1 requires measured peak active memory to stay below 50 percent with headroom, so a host that lands exactly on the threshold fails the gate. The positive purchase differences in the second table are not savings available to a host that passes all five gates.
The cost comparison counts purchase price only. The whole physical device is dedicated, so the cost is one times the physical capacity for a single device and two times for a mirror, whatever the ratio or partition. The 1.6 TB physical floor is modeled, not certified. It comes from the documented criteria, class D endurance of 7,300 TBW or more and at least 3 DWPD: a 1.6 TB drive at 3 DWPD over an assumed five-year rating is about 8,760 TBW and passes, while a 0.8 TB drive is about 4,380 TBW and does not. The five-year period is my assumption, and I have not checked the Broadcom Compatibility Guide. Broadcom’s own sizing example uses a 1.6 TB drive, which is consistent with the floor but is not proof of compatibility.
The prices are assumptions too. NVMe at 300, 600 and 1,000 dollars per terabyte is assumed, because no sourced price exists for small-capacity, 3 DWPD mixed-use drives. DRAM is taken at 14.50 dollars per GB, the 927 dollar 64 GB RDIMM Q1 2026 contract price in Counterpoint’s April 2026 Memory Price Tracker rounded from 14.48, and at 24.80 dollars per GB, the 1,586 dollar 64 GB module in a Citi Q4 2026 forecast as reported by ServNet UK, rounded from 24.78. The ServNet figure is secondary reporting of a Citi note, and the two sources do not share a baseline: Citi’s Q1 figure is 873 dollars against Counterpoint’s 927. Treat the two prices as bounds, not a trend line. The worst case below is a mirrored pair of 1.6 TB drives at 1,000 dollars per terabyte, 3,200 dollars in total. The cost arithmetic keeps unrounded DRAM avoided; the GB column is rounded for display, so a row will not reproduce exactly from the displayed GB.
| Active share (p) | Eligible share (f) | DRAM avoided (GB) | Net purchase difference at $14.50/GB | Net purchase difference at $24.80/GB |
|---|---|---|---|---|
| 25% | 100% | 1,024 | +$11,648 | +$22,195 |
| 25% | 60% | 922 | +$10,163 | +$19,656 |
| 25% | 40% | 614 | +$5,709 | +$12,037 |
| 25% | 20% | 307 | +$1,254 | +$4,419 |
| 40% | 100% to 40% | 410 | +$2,739 | +$6,958 |
| 40% | 20% | 246 | +$364 | +$2,895 |
| 10% | 20% | 369 | +$2,145 | +$5,942 |
The table above uses the 1,000 dollars per terabyte case throughout, the worst case for the device. Break-even for a mirrored 1.6 TB pair is 66, 132 and 221 GB of DRAM avoided at 14.50 dollars per GB for the three device prices, and 39, 77 and 129 GB at 24.8 dollars per GB.
⚠ UPPER BOUND, NOT A RESULT
A positive purchase difference is an upper bound on benefit, not proof that tiering is worthwhile. Not modeled: non-tierable host memory, licensing, DIMM population granularity, vSAN or backplane slot contention, runbook and operational cost, the cost of a failure window, performance penalties, write churn and replacement cadence, and cluster capacity after a host failure.
Five Gates Before You Reduce DRAM
This decision rule assumes a mirrored tier. A single-device configuration has a lower purchase cost, but it does not pass Gate 4. The model becomes a decision rule only after the measurements exist. Consider memory tiering for a host only when the measured workload passes all five gates below and the purchase comparison still favors it once the device and mirroring requirements are priced in.
01 — MEASURED PEAK ACTIVE MEMORY
Peak active memory on this specific host stays below 50 percent of the proposed DRAM, with headroom for workload variation and recovery conditions. Not an average and not a cluster figure; 50 percent is Broadcom’s guidance, not an engineered guarantee.
02 — EXCLUDED MEMORY FITS IN FULL
The memory of every VM in the nine exclusion classes, and of any VM you deactivate, fits in the reduced DRAM in full, alongside the measured active memory of the eligible VMs.
03 — COLD, ELIGIBLE MEMORY COVERS THE CUT
The cold, eligible memory is at least as large as the DRAM you remove, and the tier stays within 1:1.
04 — A QUALIFYING, MIRRORED DEVICE PAIR
A local, dedicated device pair that meets the documented criteria is available for this host, and its full cost is in the comparison.
05 — THE FAILURE WINDOW IS ACCEPTED
A named owner accepts the manual recovery path and the undocumented failure cases, in advance.
Gate five is the one no purchase model can pass for you. Someone has to own a device that holds part of every eligible VM’s memory, and accept in advance how a failure on it is recovered.
Architect’s Verdict
Memory tiering is a purchasing decision with an operating consequence. Broadcom’s documentation describes it as a fit for hosts where active memory is small and measured, where most memory is eligible, and where the tier stays at the 1:1 boundary this post worked to.
The real problem with memory tiering is that the DRAM saving is visible in the quote and the failure domain is not. The device is dedicated, a mirror doubles the cost the quote shows, and recovery is a manual maintenance window that the documentation does not put a duration on.
Nothing here establishes that a typical environment saves money, and the model deliberately does not claim it. Its baseline is hypothetical, its prices are assumptions, and its comparison is an upper bound that the unmodeled costs only reduce.
Buy less DRAM only after you have decided who owns the device that replaces it.
Additional Resources
Editorial Integrity & Security Protocol
This technical deep-dive adheres to the Rack2Cloud Deterministic Integrity Standard. All benchmarks and security audits are derived from zero-trust validation protocols within our isolated lab environments. No vendor influence.

R.M.
Senior Solutions Architect with 25+ years of experience in HCI, cloud strategy, and data resilience. As the lead behind Rack2Cloud, I focus on lab-verified guidance for complex enterprise transitions. View Credentials →
Get the Playbooks Vendors Won’t Publish
Choose the architecture problems you care about. Get field-tested playbooks and frameworks delivered to your inbox.
- > AI Infrastructure & Inference Economics
- > Cloud Strategy & Hidden Cost Models
- > Virtualization & Deterministic Migration
- > Kubernetes, IaC & Modern Infrastructure
- > Data Protection & Recovery Engineering
Zero spam. Includes The Dispatch weekly drop.
Need Architectural Guidance?
Independent review before major infrastructure decisions.
- > Validate assumptions
- > Identify hidden dependencies
- > Quantify migration risk
- > Challenge vendor narratives
Triage · Advisory · Fractional · Direct Hire