The Degradation Ladder
THE RECOVERY ENGINEERING SERIES
A system loses a replica during a routine maintenance window. Autoscaling compensates. The platform reports healthy. A week later, queue latency begins climbing during peak load — nothing outside thresholds, nothing that pages anyone. Retry traffic rises against a degraded internal API. Circuit breakers begin suppressing low-priority requests. No incident is triggered. Two weeks after the replica was lost, a routine deployment causes widespread scheduling failure because the cluster had already exhausted its resilience margin across three separate dimensions — and the monitoring stack had reported green throughout.
This is the degradation ladder. Not a failure mode. A pre-failure architecture — the accumulated loss of capacity that makes the eventual incident unrecoverable instead of manageable.
Placement: Featured image + top of post body
What the Degradation Ladder Actually Is
The degradation ladder is a sequence of capability loss events where each rung represents a measurable reduction in a system’s ability to absorb the next failure — and where no individual rung is severe enough to trigger an incident response.
The key concept is resilience margin: the operational distance between a system’s current state and the point of irreversible instability. Every rung of the degradation ladder erodes that margin. The ladder is the architecture of that erosion.
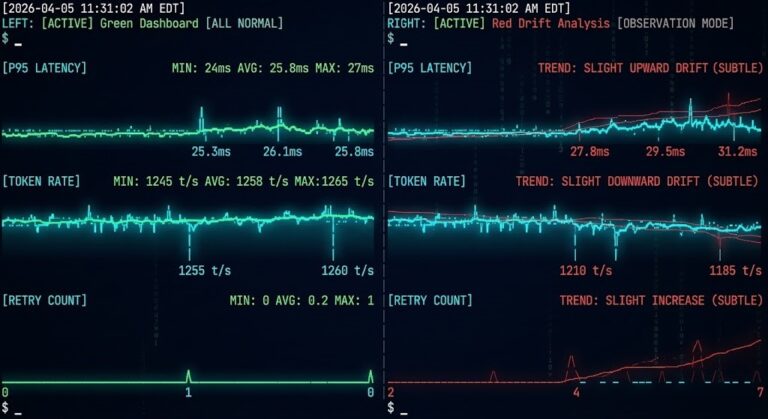
This is what makes it structurally different from a standard incident. An incident is a threshold breach — a clear point where something crosses from acceptable to unacceptable. A degradation ladder never crosses that threshold. It approaches it, rung by rung, in a way that individual threshold-based alerting is architecturally incapable of seeing.
The result is a system that appears healthy by every available metric right up until the failure that proves it wasn’t.
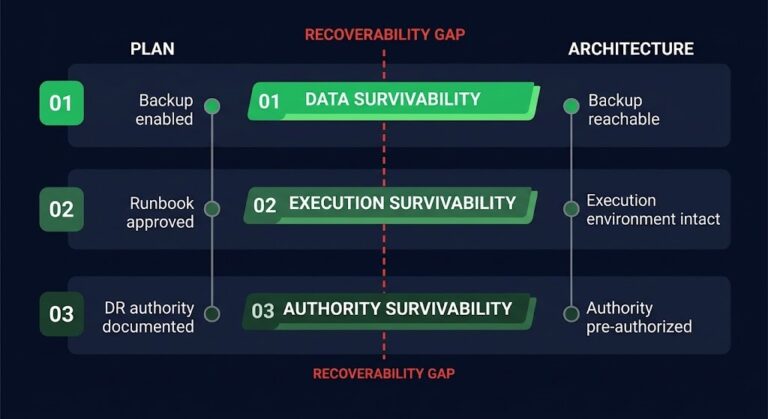
Availability is not the same thing as survivability. A system can remain available — passing health checks, serving traffic, returning 200s — long after it has stopped being resilient. The monitoring stack confirms the former. It says nothing about the latter.
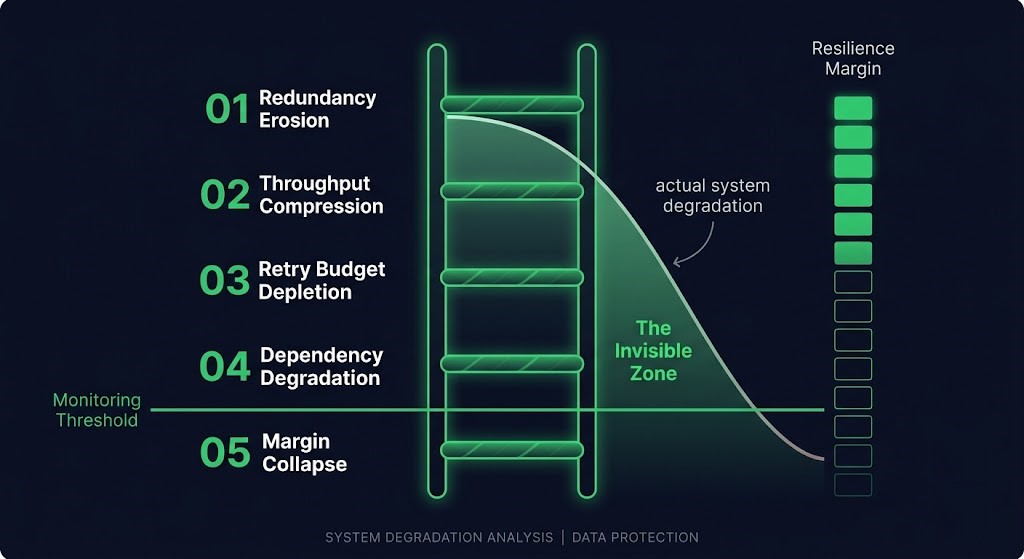
The Five Rungs
The ladder has five distinct rungs. They are not always sequential — a system can enter at rung 2 or jump from rung 1 to rung 3 depending on what fails. What they share is the property that each one reduces resilience margin without triggering a response.
01 — REDUNDANCY EROSION
A replica is lost. A node drops out of quorum. A standby goes cold. The system continues to function. The margin does not. This is the rung most commonly dismissed as resolved once the surface metric (availability) is restored — while the underlying margin (redundancy) stays depleted.
02 — THROUGHPUT COMPRESSION
Queues begin backing up. P99 response time climbs. Nothing fails. Everything slows. Throughput compression is particularly dangerous because it is self-masking — a slower system still appears to be working, and the slowness is often attributed to load rather than to structural degradation.
03 — RETRY BUDGET DEPLETION
Retry logic begins consuming its budget. Circuit breakers haven’t tripped yet. The buffer between a transient failure and a hard failure has thinned to a fraction of what the runbook assumes. The system is handling the current load. It cannot handle a concurrent failure of any significance.
04 — DEPENDENCY DEGRADATION
A secondary dependency begins returning errors at low rate. The primary system compensates through timeouts, fallbacks, or caching. The compensation works. It has a cost — increased latency, reduced throughput, elevated error handling overhead — that accumulates without registering as a failure condition.
05 — MARGIN COLLAPSE
The system is now operating with reduced capacity across multiple dimensions simultaneously. Redundancy is eroded. Throughput is compressed. Retry budget is thin. A secondary dependency is degraded. Resilience margin has not just decreased — it has collapsed. The next failure, however minor, finds no slack. What would have been a recoverable incident at rung 0 is a cascade at rung 5.
The ladder is nonlinear. A rung-4 system is not 20% worse than a rung-0 system. It is exponentially less capable of absorbing disruption — because each rung removes a different layer of the defensive architecture, and those layers were designed to work together. When three of them are gone simultaneously, the remaining two don’t provide three-fifths of the original protection. They provide almost none.
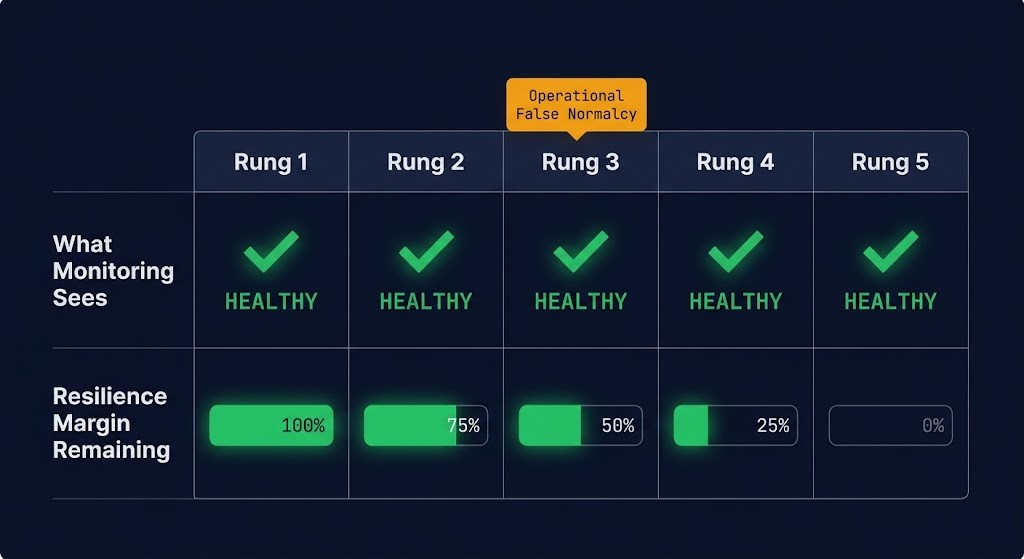
The most dangerous rung is often not rung 5. It is rung 3 — the rung where operators still trust the dashboard. Operational false normalcy: the system looks fine, behaves within acceptable ranges, and the team has no reason to believe it isn’t. The resilience margin is gone. The confidence in the system has not adjusted to reflect that.
Why Standard Alerting Misses the Ladder
Most observability platforms are optimized for incident detection, not resilience-state detection. That is not a criticism — it reflects what they were designed to do. Incident detection answers the question “is the system broken right now?” Resilience-state detection answers a different question: “how much capacity does this system have to absorb the next failure?” Most stacks answer the first question well and never attempt the second.
Standard alerting is threshold-based against current state. It fires when a metric crosses a predefined line. Below the line, silence. The degradation ladder accumulates entirely below that line — in the space between “acceptable” and “failing.” A replica loss that keeps availability above the SLA threshold generates no alert. A P99 latency increase that stays below the alerting ceiling generates no alert. A retry rate increase that doesn’t trip a circuit breaker generates no alert. Each is individually true. Together they represent a system that has lost most of its resilience margin, with no record of it anywhere in the monitoring stack.
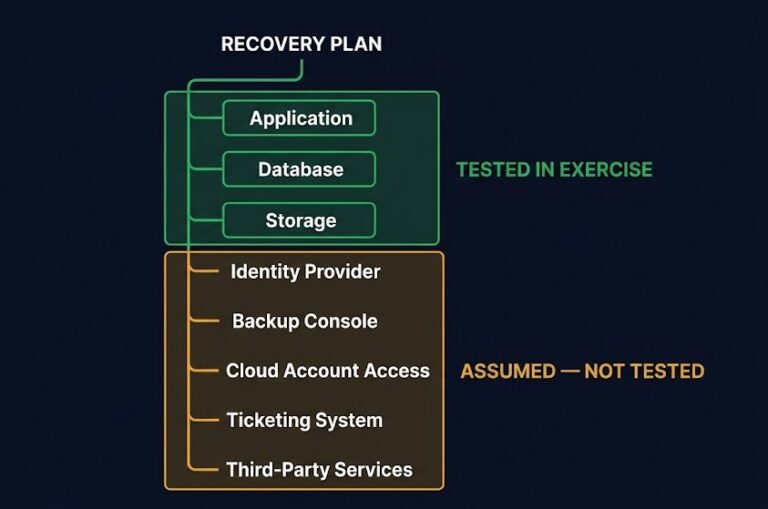
There is also a structural reason enterprises miss this that goes beyond tooling. Monitoring ownership is typically fragmented — infrastructure teams own one stack, application teams own another, security teams own a third. Each team monitors its own threshold space. Nobody is monitoring the composite state across all three. The degradation ladder climbs across those ownership boundaries in ways that no individual team sees as their problem. The replica loss is infrastructure’s ticket. The throughput compression is the application team’s metric. The dependency degradation is a network issue. The combination that represents rung-4 is nobody’s dashboard.
The incident-centric operations culture compounds this. Teams are measured on MTTR and uptime. Neither metric captures resilience margin erosion. A team that resolves the replica loss ticket, restores availability, and closes the incident has done exactly what their KPIs require — while leaving the system at rung 1 of the ladder with no record of it.
The Detection Architecture
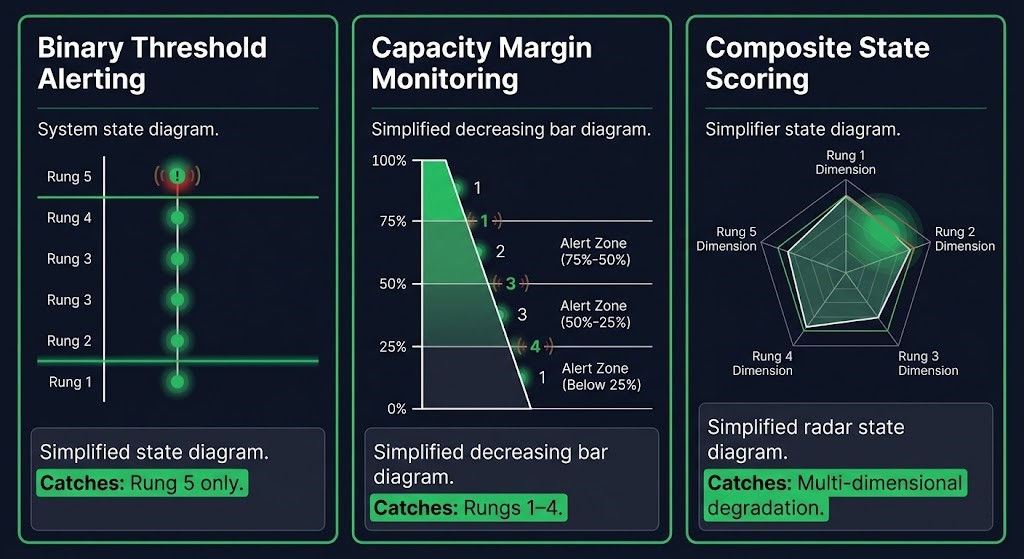
Three detection patterns that work for the degradation ladder. None of them are standard in most observability stacks. All of them are implementable without replacing existing tooling.
Capacity margin monitoring. Track the delta between current state and threshold, not just whether the threshold was crossed. A replica count of 1-of-3 and a replica count of 3-of-3 are both “healthy” in binary alert logic. Only one of them is healthy by margin logic. Margin monitoring fires not on the threshold breach but on the margin approaching a defined floor — “you are now within 20% of your resilience limit on this dimension.”
Composite state scoring. Rather than individual metric alerts, a weighted score across the five rung dimensions. When the composite score degrades across multiple dimensions simultaneously, that pattern is the signal — even if no individual dimension has crossed a threshold. A system that is at 60% of its redundancy threshold, 70% of its throughput threshold, and 50% of its retry budget simultaneously has a composite risk profile that is not captured by any individual alert. The Continuity Cascade propagates further and faster when the downstream system is already at a composite score of rung 3. Composite scoring makes that visible before the cascade begins.
Rung-transition alerting. Alert on state change between rungs, not on threshold breach. A replica loss is a rung-1 transition. That transition should fire a low-severity notice — not silence — because it represents a measurable reduction in resilience margin regardless of whether availability was affected. The transition is the signal. The threshold breach that most teams are waiting for is the consequence of ignoring the transitions.
DIAGNOSTIC QUESTION
“If three independent failures hit your system simultaneously right now, which rung would you be on — and does your monitoring stack know the answer?”
The observability vs monitoring gap is the architectural root of this problem. Monitoring confirms systems are running. Observability surfaces what the system is doing. Neither, by default, measures what the system can still absorb. Resilience-state detection is a third discipline that most teams have not built — not because the tooling doesn’t exist, but because the question has never been framed as a measurement problem.
Where the Degradation Ladder Connects to the Series
The Recovery Engineering Series has built a framework for understanding why recovery fails even when the mechanics work. The degradation ladder is the pre-event layer that series was missing.
Part 1 — The Retry Storm: Retry budget depletion is rung 3 of the ladder. The retry storm doesn’t originate in a healthy system — it originates in a system that had already lost its retry margin through accumulated degradation. The storm is the consequence of treating the budget as infinite until the circuit breaker trips.
Part 2 — Recovery Doesn’t End the Incident: The six closure gates are harder to clear when the restored system returns to a rung-3 or rung-4 environment. Environment re-trust fails faster when the platform it restored into was already degraded. The gates are designed assuming the restored environment has full resilience margin. When it doesn’t, the closure process is working against the same ladder that contributed to the incident. Disaster recovery authority degrades the same way — the primary coordinator is unavailable, the backup is unclear, escalation reaches someone with no context. Each step costs time and widens blast radius. Authority degradation is a specific type of ladder event that most resilience programs never instrument.
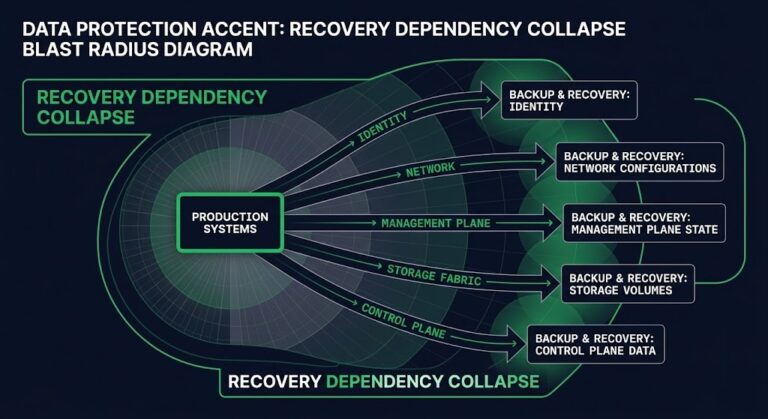
Part 3 — The Continuity Cascade: The cascade propagates further and faster when downstream systems are already on the ladder. A rung-4 dependency doesn’t absorb a primary failure — it amplifies it. Every hop in the cascade chain is worse when the receiving system has no slack.
At the infrastructure layer, the HCI cluster is the system most likely to be on the ladder silently — because the metrics that confirm availability (Prism health, CVM status, replication factor) say nothing about whether the cluster’s resilience margin has already been eroded by rebuild debt, controller overhead, or upgrade deferral. The HCI Failure-State Architecture specialization track models this as the Failure-State Envelope: the operational boundary an HCI cluster must maintain to remain deterministic not just during steady state, but during the conditions that expose ladder rungs.
Architect’s Verdict
The degradation ladder isn’t a failure mode that shows up in the postmortem. It shows up in the months before the postmortem — in the replica that was never replaced after the maintenance window, the retry budget that was never reset after the transient spike, the secondary dependency that started returning errors at 0.2% and was filed as a known issue. Each of these is individually manageable. Together they represent a system that has already failed — in the only way that matters architecturally — before the incident that makes it visible.
Most recovery architectures are designed for rung 5: the hard failure that triggers the incident, breaks the threshold, pages the team. None of them are designed for rung 2 or rung 3, where the remediation cost is hours of engineering work and the prevention value is the difference between a recoverable incident and a catastrophic one. The ladder climbs in the silence between alerts — in the space the monitoring stack doesn’t measure, across the ownership boundaries no team is watching, during the periods when everything technically still works.
Catastrophic outages rarely begin at the moment of collapse. They begin when systems start losing resilience faster than operators can see it.
Additional Resources
Editorial Integrity & Security Protocol
This technical deep-dive adheres to the Rack2Cloud Deterministic Integrity Standard. All benchmarks and security audits are derived from zero-trust validation protocols within our isolated lab environments. No vendor influence.
R.M.
Senior Solutions Architect with 25+ years of experience in HCI, cloud strategy, and data resilience. As the lead behind Rack2Cloud, I focus on lab-verified guidance for complex enterprise transitions. View Credentials →
Get the Playbooks Vendors Won’t Publish
Field-tested blueprints for migration, HCI, sovereign infrastructure, and AI architecture. Real failure-mode analysis. No marketing filler. Delivered weekly.
Select your infrastructure paths. Receive field-tested blueprints direct to your inbox.
- > Virtualization & Migration Physics
- > Cloud Strategy & Egress Math
- > Data Protection & RTO Reality
- > AI Infrastructure & GPU Fabric
Zero spam. Includes The Dispatch weekly drop.
Need Architectural Guidance?
Unbiased infrastructure audit for your migration, cloud strategy, or HCI transition.
>_ Request Triage Session