The Dashboard Said the Migration Succeeded
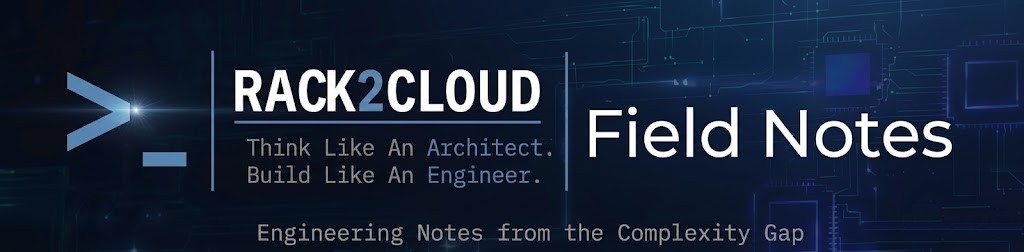
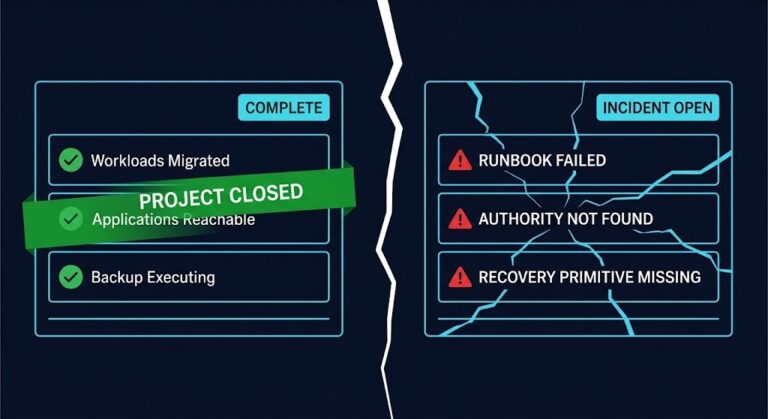
Migration dashboard failure has a consistent pattern: the tooling reports 100% complete, health checks pass, services respond — and production discovers a different set of facts three weeks later. The dashboard wasn’t wrong. It measured exactly what it was designed to measure. Task completion against a pre-defined scope. Operational continuity was never in that scope.
The dashboard was accurate. It measured what it was designed to measure. Task completion against a pre-defined scope: VMs moved, services restarted, connectivity validated, health checks passing. Everything within the migration boundary checked out. What it didn’t — couldn’t — measure is whether the environment on the other side of the cutover is operationally continuous with the environment that preceded it. That’s a different question, answered by different evidence, over a different time horizon.
The Migration Dashboard Failure Mode: What the Tooling Actually Measured
Migration tooling is scoped to migration tasks. That sounds obvious until you’re in a post-cutover incident bridge call at 02:30 and someone asks why the monitoring didn’t catch it before the business noticed.
The scope boundary is where the problem lives. A migration project defines success as the completion of a set of tasks against a set of VMs, services, or workloads. The tooling tracks that scope: did the workload move, did it restart, does it respond to health checks on the new platform. When all tasks complete and all checks pass, the dashboard turns green. From inside the migration boundary, that’s a correct and complete assessment.
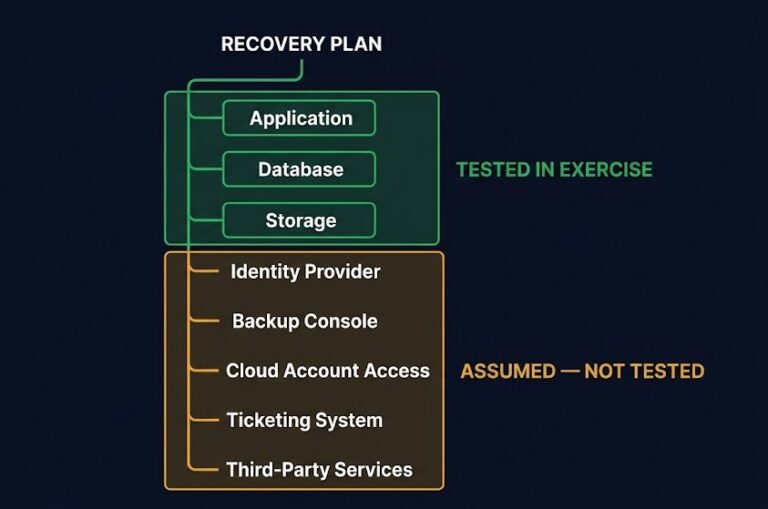
The issue is what the migration boundary excluded. Everything that wasn’t a migration task is outside the scope — which means it’s outside the measurement. Backup jobs that were connected to the old environment. DR orchestration that assumed a specific storage topology. Monitoring agents that were registered against the source platform and never re-registered. Certificate trust chains that depended on an identity provider that is now one network hop further away. None of those are migration tasks. None of them appear on the dashboard. All of them will surface eventually — usually during the first incident post-cutover, when the ops team discovers the environment they’re trying to recover doesn’t match the runbook they practiced.
Task Completion Is Not Operational Continuity
The migration contract defines what moves. The operational environment is larger than what moved.
What breaks first after you leave VMware is rarely the workload that was in scope. The VM that was carefully migrated, tested, and validated typically performs as expected. What breaks is the operational layer around it — the backup policy that assumed VSS quiescing on a hypervisor that no longer exists, the performance baseline that was established on storage with different I/O characteristics, the runbook that assumed a specific failover path that was reconfigured during migration without documentation.
The virtualization control plane post covers why platform differences compound at the management layer — not just at the workload layer. That’s the exact dynamic that makes migration dashboards structurally incomplete. They validate workload behavior inside the new environment. They don’t validate whether the operational infrastructure that governs that environment — monitoring, backup, DR, identity, performance baselines — was carried across with equivalent fidelity. This is the governance portability gap the Sovereign Virtualization Architecture stage maps at the platform level — the distinction between moving workloads and preserving the governance architecture that governs them.
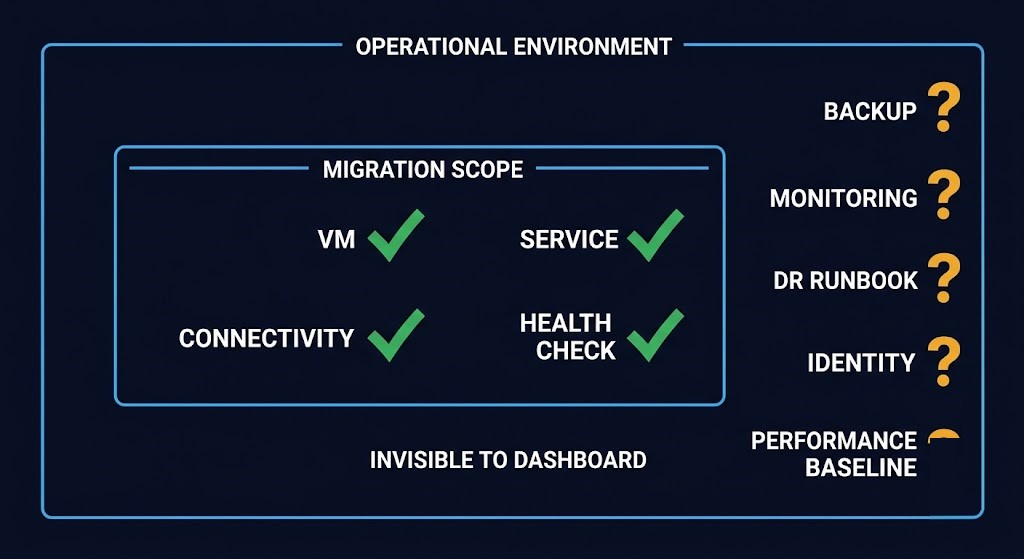
THE SCOPE BOUNDARY ILLUSION
Anything outside the migration tooling scope becomes operationally invisible — even if it’s production-critical. The dashboard measures the migration. Production measures continuity. Those are not the same boundary.
The Four Things No Migration Dashboard Tracks
The Scope Boundary Illusion has a consistent failure pattern. Across migration projects of different scale and technology, the same four categories fall outside the migration contract and surface post-cutover. The Scope Boundary Illusion has a consistent failure pattern. Across migration projects of different scale and technology, the same four categories fall outside the migration contract and surface post-cutover. The architectural work of anticipating and closing each of these gaps before cutover — not after — is
what the VMware Migration Strategy Track covers across its Failure Domains and Governance Normalization clusters.
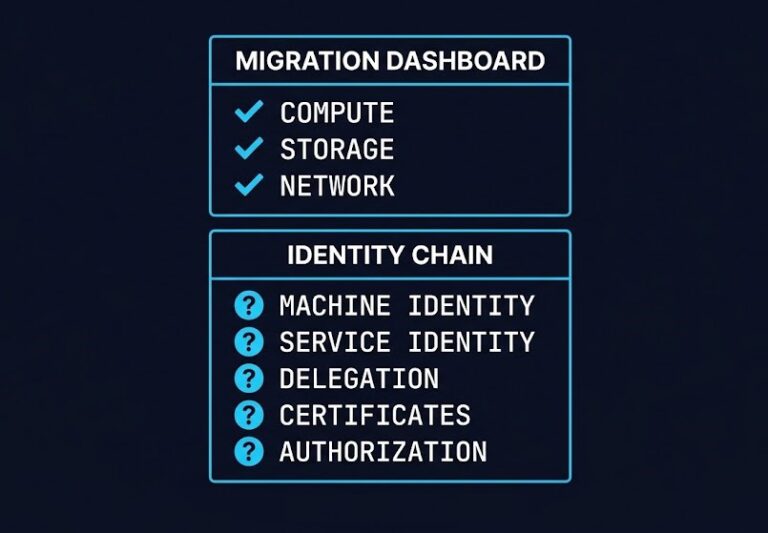
01 — IDENTITY CONTINUITY
Kerberos tickets, certificate trust chains, time synchronization, service principal mappings. These dependencies are invisible during migration validation because they don’t fail immediately — they fail when the ticket expires, the certificate renewal fires against the wrong authority, or the clock drift crosses a threshold. The workload was healthy at cutover. The identity infrastructure it depended on was quietly broken.
02 — OPERATIONAL DEPENDENCY REATTACHMENT
Backup agents, monitoring hooks, DR orchestration registrations, CMDB entries. These are not migration tasks — they’re operational hygiene tasks that happen after migration. In practice, they’re often deferred, partially completed, or assumed to have migrated with the workload. They didn’t. The backup job is pointed at a source that no longer holds the live data. The DR runbook targets a storage path that was reconfigured. The monitoring agent is registered against the old platform and reporting nothing.
03 — LATENT PERFORMANCE DEGRADATION
Queue depth behavior, storage latency profiles, east-west traffic patterns. The workload responds correctly during validation — health checks pass, connectivity confirmed, application layer functional. What validation doesn’t surface is whether the performance envelope matches what was established on the source platform. Storage I/O characteristics differ between hypervisors. Network latency between services shifts when topology changes. The degradation is real but sub-threshold during the validation window. It surfaces under load, during backup windows, or when the queue backs up for the first time.
04 — HUMAN RECOVERY READINESS
Whether the operations team can actually diagnose and recover from failures in the new environment. Runbooks written for the source platform, muscle memory built on tools that no longer apply, on-call procedures that assume infrastructure behaviors the new platform doesn’t replicate. This is the hardest one to measure and the most consequential — because every other failure mode on this list is manageable if the team can diagnose it quickly. If they can’t, the blast radius of any post-cutover incident expands until someone figures out where the new environment diverges from the mental model they brought over from the old one.
The VMware migration identity gap post covers the fourth pattern in detail — the operational team that inherited an environment that no longer matches the runbooks they practiced against. The skills gap that precedes a VMware exit doesn’t close at cutover. It surfaces post-cutover, when the environment the team needs to operate is different from the one they trained on.
Why Vendors Don’t Solve This
Migration tooling vendors are incentivized to measure task completion because task completion is objectively reportable. Every VM moved, every service restarted, every health check passed — that’s a number. A percentage. A green status on a dashboard. It’s auditable, contractable, and defensible in a post-migration review.
Operational continuity is environment-specific, organizationally dependent, and difficult to automate. It depends on whether your backup team updated the job targets. Whether your monitoring team re-registered the agents. Whether the on-call engineer who responds to the first post-cutover incident has the right runbook for the new platform. None of those are things a migration vendor can measure, report, or guarantee — which means they’re not in scope, which means they don’t appear on the dashboard, which means they remain invisible until production surfaces them.
Uptime Institute’s infrastructure analysis found that over 60% of outages now cost at least $100,000 in total losses — most of them surfacing after the migration dashboard had already turned green. That’s the structural cause of migration dashboard failure: the dashboard is accurate within its scope. The scope just doesn’t include everything production depends on.
Architect’s Verdict
The migration succeeded according to the dashboard because the dashboard only measured the migration. Production measures continuity differently.
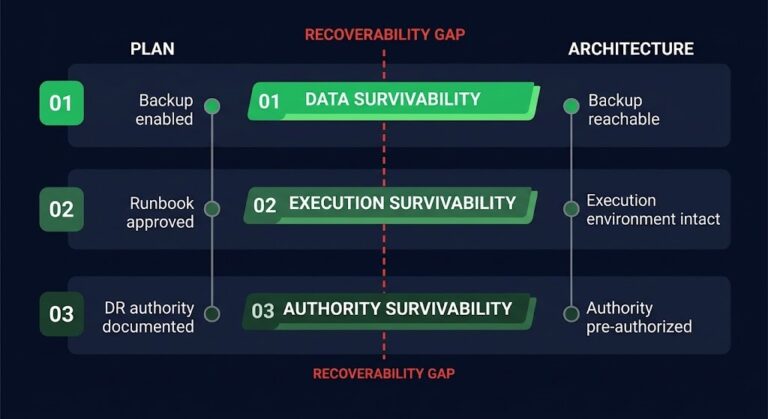
The Scope Boundary Illusion is persistent because it’s structural, not accidental. Migration tooling measures what migrations produce: moved workloads, passed health checks, validated connectivity. It doesn’t measure what operational continuity requires: reattached backup infrastructure, re-registered monitoring, validated recovery procedures, performance baselines that match the source environment. Those aren’t migration tasks. They’re post-migration operational tasks that fall outside the scope the tooling was built to track.
The teams that handle post-cutover best are the ones that treat the dashboard green as the starting line for operational validation, not the finish line for the project. The migration completed. The environment isn’t production-ready until the four things the dashboard didn’t track have been explicitly verified. That verification gap is what sovereign architecture is designed to close — governance authority, operational continuity, and lifecycle control that survive the platform transition intact, not reassembled after the fact.
Additional Resources
Editorial Integrity & Security Protocol
This technical deep-dive adheres to the Rack2Cloud Deterministic Integrity Standard. All benchmarks and security audits are derived from zero-trust validation protocols within our isolated lab environments. No vendor influence.
R.M.
Senior Solutions Architect with 25+ years of experience in HCI, cloud strategy, and data resilience. As the lead behind Rack2Cloud, I focus on lab-verified guidance for complex enterprise transitions. View Credentials →
Get the Playbooks Vendors Won’t Publish
Field-tested blueprints for migration, HCI, sovereign infrastructure, and AI architecture. Real failure-mode analysis. No marketing filler. Delivered weekly.
Select your infrastructure paths. Receive field-tested blueprints direct to your inbox.
- > Virtualization & Migration Physics
- > Cloud Strategy & Egress Math
- > Data Protection & RTO Reality
- > AI Infrastructure & GPU Fabric
Zero spam. Includes The Dispatch weekly drop.
Need Architectural Guidance?
Unbiased infrastructure audit for your migration, cloud strategy, or HCI transition.
>_ Request Triage Session