Backup Success Rates Are a Dangerous Metric

Backup success rate is a dangerous metric because it measures job completion, not recoverability. It persists for a simple reason: backup success is observable every day, and recoverability is usually only observable during testing or failure. One produces a number every morning. The other produces a number only when something has already gone wrong.
Most organizations run their entire data protection architecture on the number that’s easiest to check.
Why Backup Success Rate Became the Metric
Backup jobs produce clean numbers. A job either ran to completion or it didn’t. That binary outcome rolls up cleanly into a percentage, and percentages are exactly what get put in front of leadership.
Executives like percentages because percentages compress a sprawling, technical system into a single defensible figure. Dashboards like success rates because success/fail states aggregate trivially — thousands of jobs collapse into one number without anyone having to reason about what any individual job actually protected. And success rates scale operationally: a platform team can report on ten thousand jobs a night using the exact same metric they’d use to report on ten.
Recoverability doesn’t offer any of that. You can’t observe recoverability by watching a job queue. You can only observe it by actually restoring something — a full database, a VM, an application stack — and confirming the result is usable. That’s expensive, it’s disruptive to schedule, and it can only happen intermittently. Backup success became the metric because it could be measured continuously. Recoverability never earned the same status because it could only be measured intermittently.
The result is predictable: organizations optimize for the metric that’s easiest to collect rather than the outcome they actually care about. Nobody sets out to mistake a proxy for a result. It happens because the proxy is the only thing generating a number every single day.
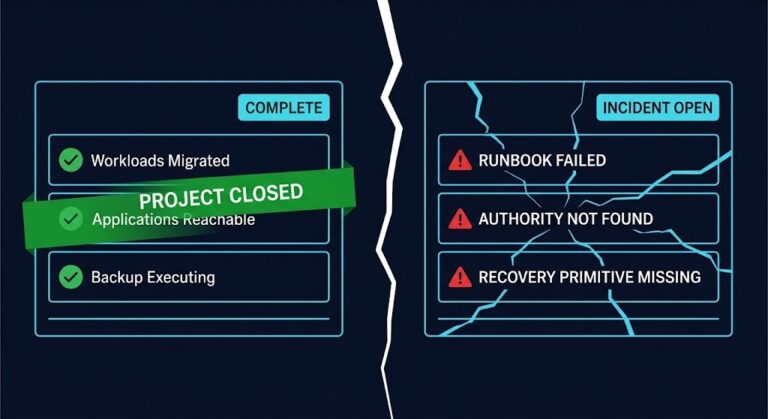
The Three Things Hiding Behind the Checkmark
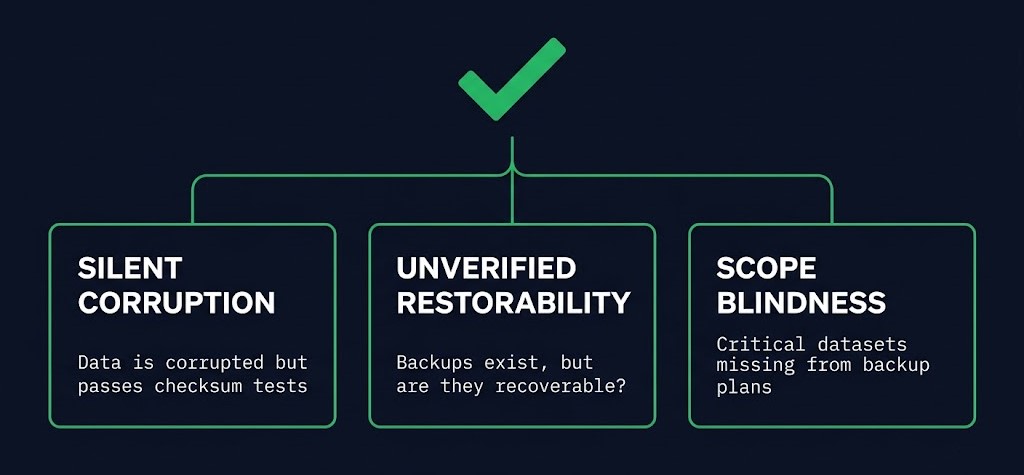
A green checkmark in a backup dashboard tells you a job completed under whatever definition of “completed” the software uses. It does not tell you what that job actually protected, or whether the result of that job can produce a working system. Three specific failure modes hide behind that checkmark, and none of them show up as a failed job.
Silent Corruption
The job runs, retention policy is satisfied, the log shows success — and the resulting restore point is unusable. This is most common with application-consistent workloads: databases, transactional systems, anything where “the bytes copied correctly” is a different claim from “the application can start from this state.” A crash-consistent backup of a database can report success every night for months while producing a restore point that fails the moment someone actually tries to bring the database up from it. The backup software has no mechanism to know this — the gap starts at the backup architecture foundation, not the dashboard. It measured the copy, not the outcome.
Unverified Restorability
The job succeeds, and nobody has ever restored from it. This is the write-only backup problem — protection architecture running in one direction only, with restore treated as a theoretical capability rather than a tested one. A backup that has never been restored isn’t a known-good recovery point. It’s an assumption wearing a green checkmark.
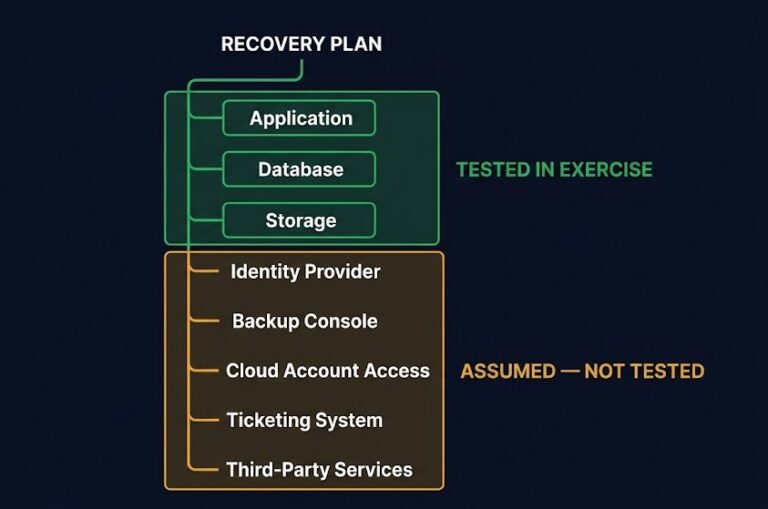
Scope Blindness
The job succeeds, but the job’s scope has quietly drifted from what the business believes is protected. New volumes get added to a server and never get added to the backup policy. A migrated workload keeps its old backup job pointed at infrastructure that no longer matters. The success rate stays clean because everything inside the job’s defined scope is, in fact, backing up successfully — the metric is accurate and irrelevant at the same time, because the scope itself has stopped matching reality.
None of these three show up as a red row in a backup console. All three sit underneath a 99%+ success rate, which is exactly what makes them dangerous — the metric that’s supposed to flag a problem is structurally incapable of seeing any of them.
Metric Drift
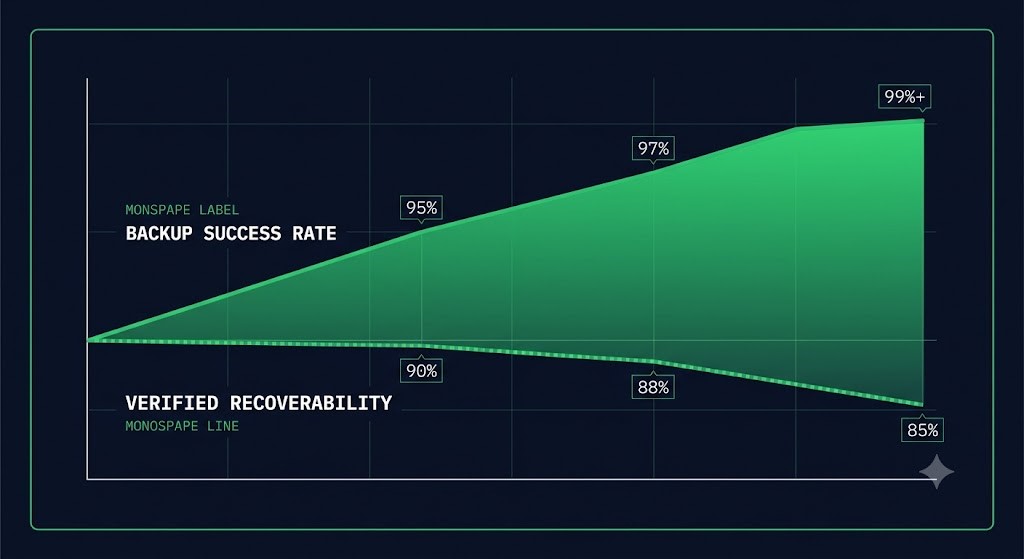
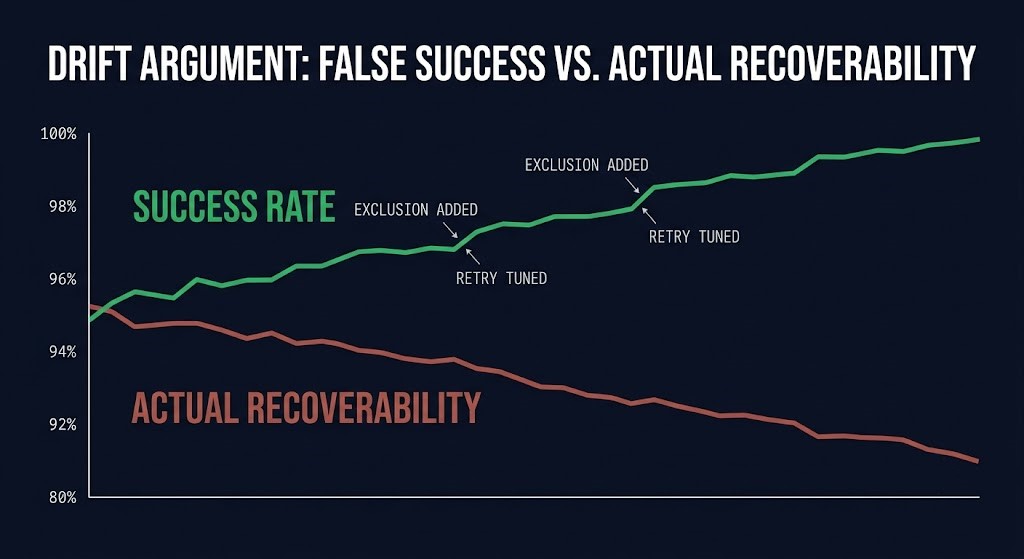
The more interesting failure mode is what happens to the success rate over time. It’s not static — and it doesn’t degrade when recoverability degrades. It often does the opposite.
Backup jobs get tuned to stop failing. Exclusions get added for volumes or file types that were causing errors. Retry logic gets more forgiving. Anything that consistently threw a failure eventually gets scoped out, rescheduled, or quietly dropped from the job definition rather than fixed. Each of these changes moves the success rate up. None of them moves recoverability up — several of them move it down, because the excluded item is usually excluded precisely because it was hard to protect correctly, not because it stopped mattering.
The success rate improves. The protection posture doesn’t. Anyone tracking the metric in isolation sees a system getting healthier over an interval where it’s actually getting worse.
Why This Compounds at Scale
Individually, each of these failure modes is bad but bounded — a single corrupted restore point, a single untested job, a single scope gap. It’s the same mistaken-proxy problem DR tests fall into one layer up — a passed test and a passed job are both process confirmations, not recovery confirmations. The problem is that success rate dashboards are built to aggregate, and aggregation is exactly what erases the signal.
Rolling ten thousand jobs into a single 99.4% figure means a handful of silently corrupted restore points, a set of never-tested jobs, and a slowly drifting scope boundary are all sitting inside the 0.6% of statistical noise that nobody investigates. The aggregate number isn’t wrong. It’s just answering a different question than the one the organization thinks it’s asking. This is functionally the same gap #153 Restore Design Gap names at the individual-post level — the distance between data that was successfully copied and a system that has been verifiably recovered (evidence, not just completion). Backup success rate is that gap, expressed as a KPI instead of an incident — which is exactly why RTO, RPO, and RTA are the metrics that should be driving infrastructure design instead.
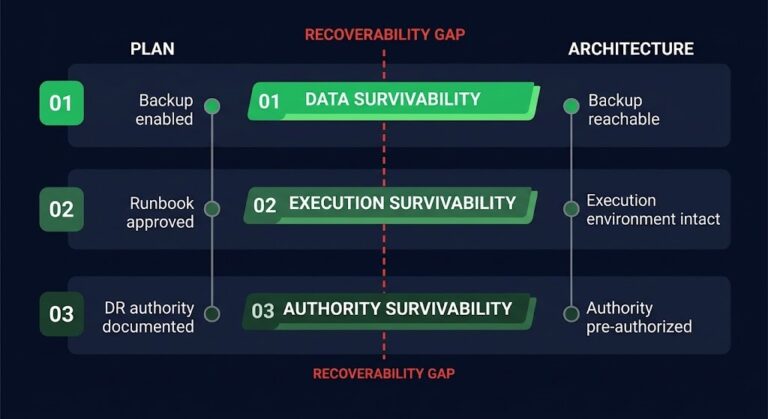
It’s worth being precise about what this isn’t. It isn’t the Recoverability Gap — that framework describes what happens to recovery architecture specifically under adversarial, ransomware-class conditions, where identity, credentials, and control plane authority are also compromised. What’s described here is upstream and simpler: a measurement problem that exists even in a clean-failure world, before an adversary is involved at all. Backup Success → Restore Design → Recoverability is a progression from “is the metric honest” to “does the design hold up” to “does it hold up under attack.” This post lives entirely at the first step.
Architect’s Verdict
Backup success rates tell you whether a process completed. They do not tell you whether recovery is possible.
The most dangerous backup environments are often the ones with the cleanest dashboards, because job completion is being mistaken for recoverability — and that mistake is invisible from inside the dashboard that’s making it. The number that gets reported every day and the outcome that actually matters are not the same claim, and no amount of tuning the first one produces the second.
If the only evidence a recovery plan can produce is a success rate, it hasn’t produced evidence of recovery. It’s produced evidence of scheduling.
Additional Resources
Editorial Integrity & Security Protocol
This technical deep-dive adheres to the Rack2Cloud Deterministic Integrity Standard. All benchmarks and security audits are derived from zero-trust validation protocols within our isolated lab environments. No vendor influence.
R.M.
Senior Solutions Architect with 25+ years of experience in HCI, cloud strategy, and data resilience. As the lead behind Rack2Cloud, I focus on lab-verified guidance for complex enterprise transitions. View Credentials →
Get the Playbooks Vendors Won’t Publish
Field-tested blueprints for migration, HCI, sovereign infrastructure, and AI architecture. Real failure-mode analysis. No marketing filler. Delivered weekly.
Select your infrastructure paths. Receive field-tested blueprints direct to your inbox.
- > Virtualization & Migration Physics
- > Cloud Strategy & Egress Math
- > Data Protection & RTO Reality
- > AI Infrastructure & GPU Fabric
Zero spam. Includes The Dispatch weekly drop.
Need Architectural Guidance?
Unbiased infrastructure audit for your migration, cloud strategy, or HCI transition.
>_ Request Triage Session